- EUR/GBP stalled its recent recovery move from one-year lows near the 0.8730 region.
- Mixed oscillators on hourly/daily charts warrant some before placing directional bets.
- A sustained break below 0.8600 will negate prospects for any meaningful recovery.
The EUR/GBP cross gained positive traction for the second consecutive session on Friday and built on this week’s solid rebound from one-year lows.
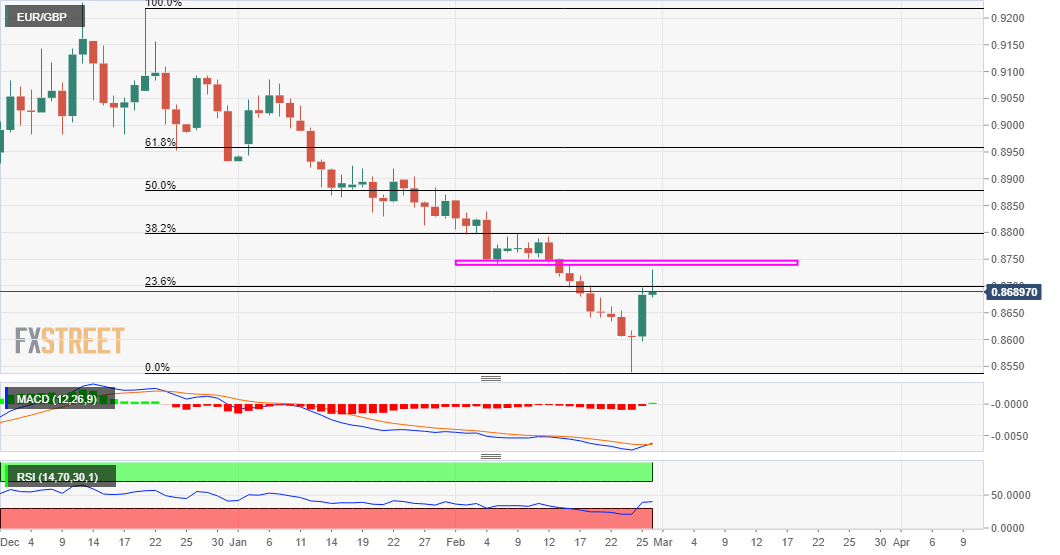
The momentum pushed the cross beyond the 23.6% Fibonacci level of the 0.9218-0.8539 downfall, albeit stalled near the 0.8730 level. The mentioned region nears a previous horizontal support breakpoint, now turned resistance around the 0.8745-50 region, which should now act as a key pivotal point for short-term traders.
Meanwhile, technical indicators on hourly charts have been gaining positive traction and support prospects for additional intraday gains. That said, oscillators on the daily chart – through have been recovering from the bearish territory – are yet to confirm a positive bias and warrants some caution for bullish traders.
This makes it prudent to wait for a sustained strength beyond the said support-turned-resistance before positioning for any further appreciating move. Some follow-through buying will set the stage for a move towards the 0.8800 mark (38.2% Fibo.) en-route mid-0.8800s and 50% Fibo. level, near the 0.8875-80 region.
On the flip side, any further pullback now seems to find decent support near the 0.8645-40 region. This is followed by the recent daily closing lows support, near the 0.8600 mark, which if broken decisively should pave the way for the resumption of the recent downward trajectory witnessed over the past two months or so.
EUR/GBP daily chart
Technical levels to watch
