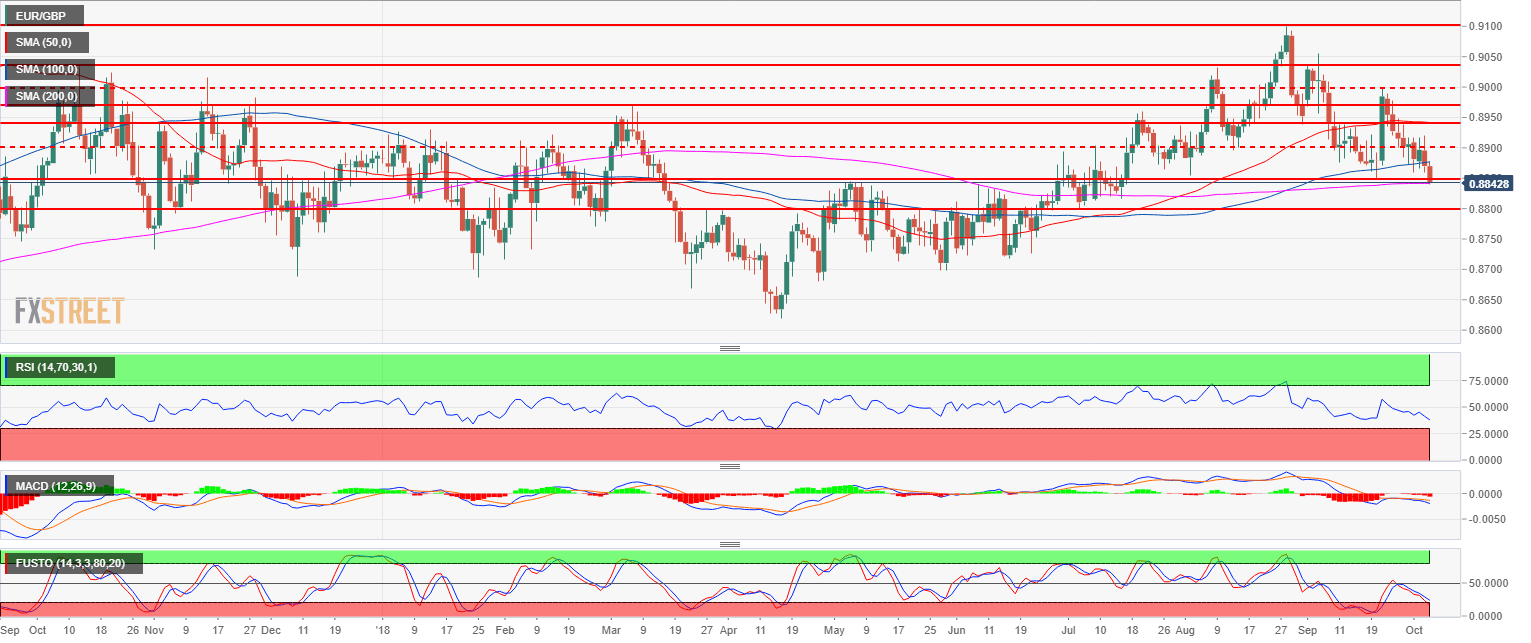
- EUR/GBP is drifting lower as it broke 0.8847 (September 20 low) and is currently testing the 200-period simple moving average.
- The RSI, MACD and Stochastics indicators are bearishly configured on the daily time-frame suggesting continued weakness.
- Targets to the downside can be located near 0.8800 figure and 0.8764 (June 8 low).
EUR/GBP daily chart
EUR/GBP
Overview:
Last Price: 0.8842
Daily change: -28 pips
Daily change: -0.316%
Daily Open: 0.887
Trends:
Daily SMA20: 0.8911
Daily SMA50: 0.8942
Daily SMA100: 0.8876
Daily SMA200: 0.8842
Levels:
Daily High: 0.892
Daily Low: 0.886
Weekly High: 0.899
Weekly Low: 0.8872
Monthly High: 0.9054
Monthly Low: 0.8848
Daily Fibonacci 38.2%: 0.8883
Daily Fibonacci 61.8%: 0.8897
Daily Pivot Point S1: 0.8846
Daily Pivot Point S2: 0.8823
Daily Pivot Point S3: 0.8786
Daily Pivot Point R1: 0.8907
Daily Pivot Point R2: 0.8944
Daily Pivot Point R3: 0.8968
Main Trend: Neutral to bearish
Resistances and Supports:
Resistance 1: 0.8876 September 11 low
Resistance 2: 0.8896 August 14 swing low
Resistance 3: 0.8940 August 14 high
Resistance 4: 0.8974 September 6 low
Resistance 5: 0.9000 figure
Resistance 6: 0.9032 August 9 high
Resistance 7: 0.9100, current 2018 high
Support 1: 0.8847-42 September 20 low and 200-DSMA (key support)
Support 2: 0.8800 figure
Support 3: 0.8764 June 8 low
