- EUR/GBP is trading down for the second consecutive day after reaching a new 2018 high this Thursday.
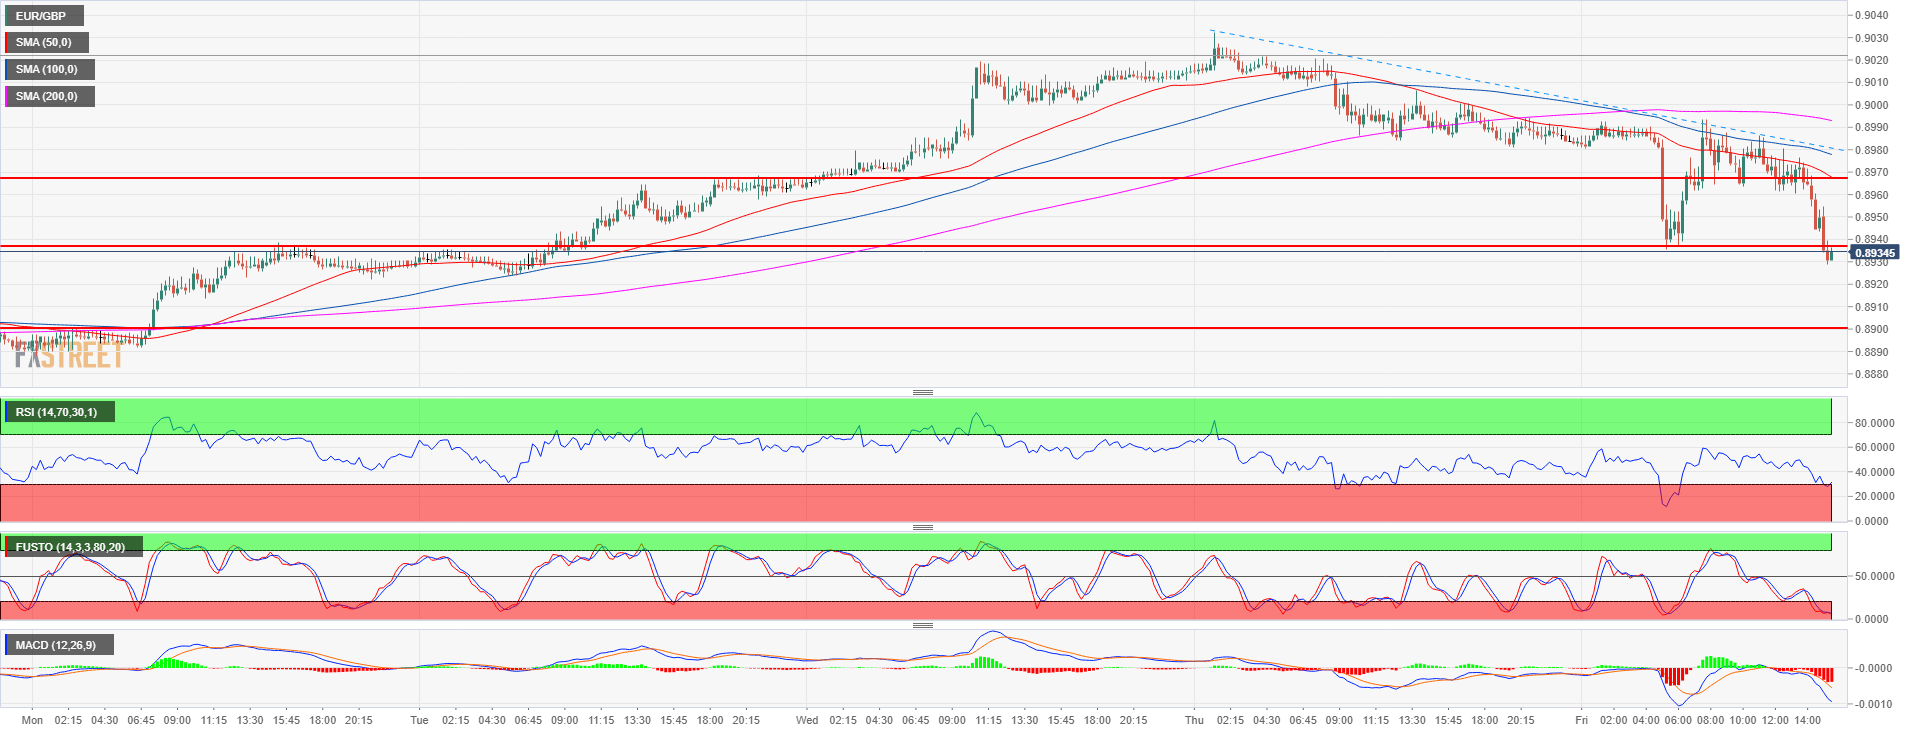
- EUR/GBP is currently printing new daily lows below 0.8937 support as EUR/GBP momentum is switching to short-term bearish. EUR/GBP is trading below its main simple moving averages on the 15-minute chart.
- EUR/GBP bears next targets to the downside are seen near 0.8920 supply level and 0.8900 July 9 high.
EUR/GBP 15-minute chart
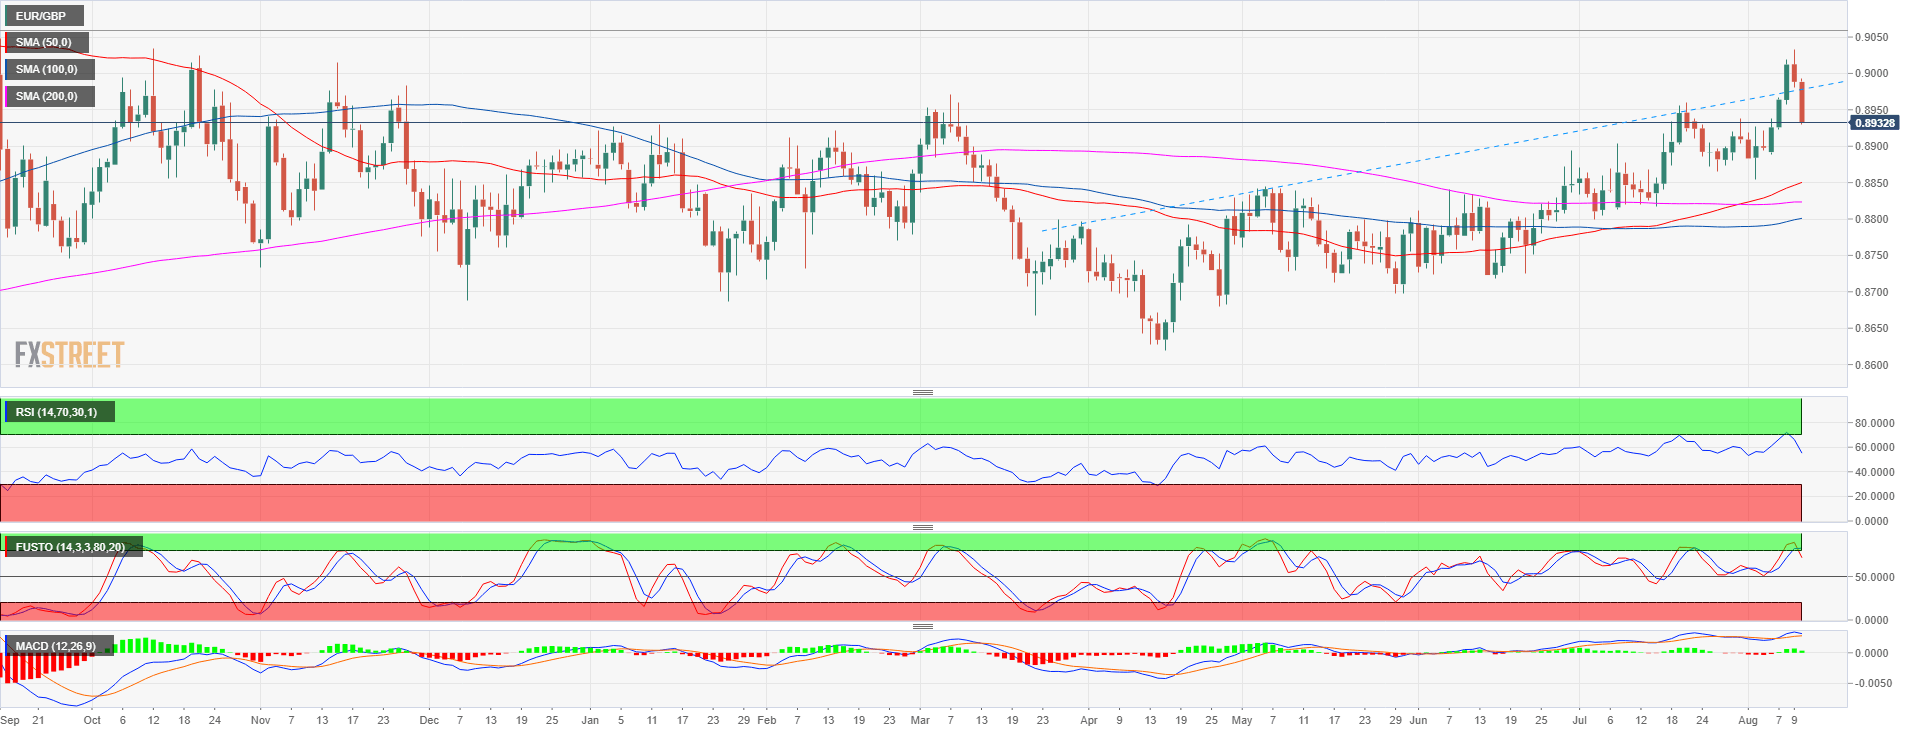
EUR/GBP daily chart
Spot rate: 0.8934
Relative change: -0.61%
High: 0.8933
Low: 0.8928
Main Trend: Bullish
Short-term Trend: Bearish below 0.9000
Resistance 1: 0.8937 July 31 high
Resistance 2: 0.8957/67 area, July 20 high and March 7 high
Resistance 3: 0.9019 August 9 high
Resistance 4: 0.9109 September 8, 2017 low
Resistance 5: 0.9160 August 23, 2017 low
Support 1: 0.8920 supply level
Support 2: 0.8900 July 9 high
Support 3: 0.8868, 13 July high
Support 4: 0.8840 supply level
Support 5: 0.8820-0.8840 area, 200-day SMA
Support 6: 0.8800 figure
Support 7: 0.8780 daily 50-period SMA
Support 8: 0.8764 June 8 low
