“¢ Overnight bullish breakthrough a one-week-old trading range stalls near a descending trend-line resistance, extending from Oct. 2017 high through Nov. 2017 and March 2018 tops.
“¢ Short-term technical indicators maintain their bullish bias and the fact that the cross remains comfortably above short/medium/long-term moving averages (50, 100 & 200-day) should help limit any meaningful corrective slide.
“¢ Today’s release of the latest UK/final EZ consumer inflation figures will now be looked upon for fresh impetus and might attract some dip-buying interest at lower levels.
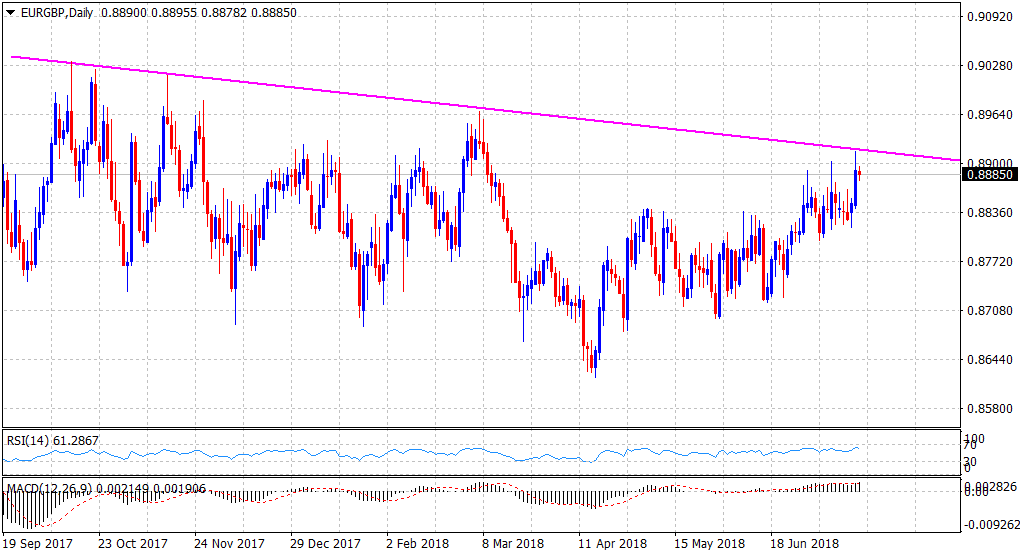
Spot rate: 0.8885
Daily High: 0.8896
Trend: Bullish
Resistance
R1: 0.8915 (overnight swing high)
R2: 0.8961 (R2 daily pivot-point)
R3: 0.9000 (psychological round figure mark)
Support
S1: 0.8860 (horizontal zone)
S2: 0.8820 (200-day SMA)
S3: 0.8806 (S2 daily pivot-point)
