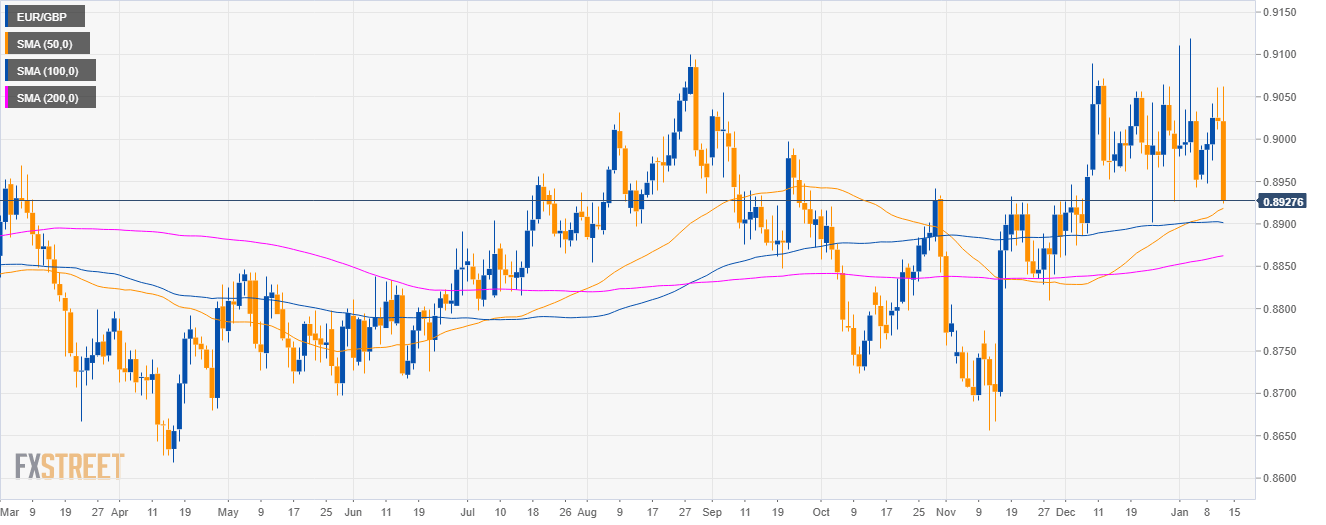
EUR/GBP daily chart
- EUR/GBP is trading in a sideways trend above the 200-period simple moving average (SMA).
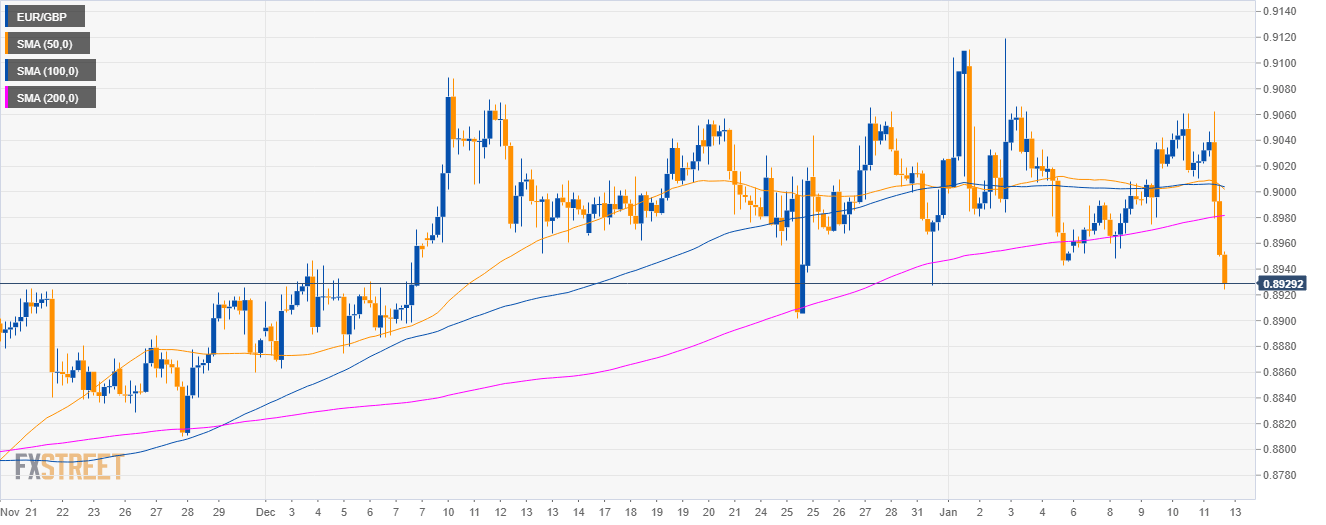
EUR/GBP 4-hour chart
- EUR/GBP is declining below its main SMAs.
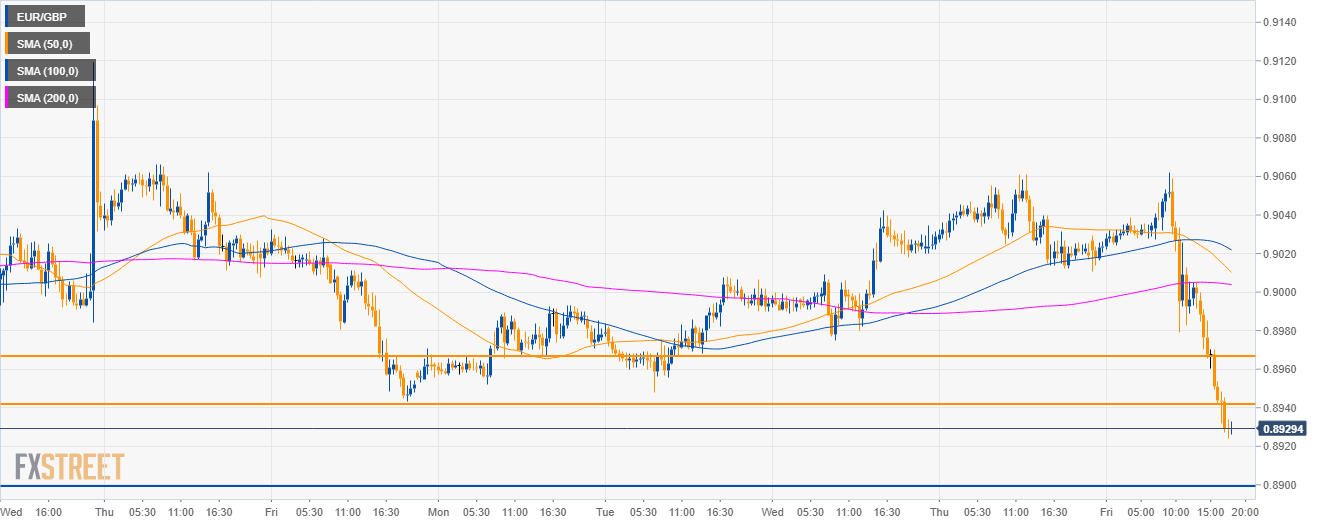
EUR/GBP 30-minute chart
- EUR/GBP broke below the 0.8940 support opening the doors to 0.8900 and 0.8840 bearish targets in the coming sessions.
Additional key levels
EUR/GBP
Overview:
Today Last Price: 0.8929
Today Daily change: -92 pips
Today Daily change %: -1.02%
Today Daily Open: 0.9021
Trends:
Previous Daily SMA20: 0.9001
Previous Daily SMA50: 0.8915
Previous Daily SMA100: 0.8903
Previous Daily SMA200: 0.8861
Levels:
Previous Daily High: 0.9061
Previous Daily Low: 0.9012
Previous Weekly High: 0.9119
Previous Weekly Low: 0.8927
Previous Monthly High: 0.9089
Previous Monthly Low: 0.8863
Previous Daily Fibonacci 38.2%: 0.9031
Previous Daily Fibonacci 61.8%: 0.9042
Previous Daily Pivot Point S1: 0.9002
Previous Daily Pivot Point S2: 0.8982
Previous Daily Pivot Point S3: 0.8953
Previous Daily Pivot Point R1: 0.9051
Previous Daily Pivot Point R2: 0.908
Previous Daily Pivot Point R3: 0.91
