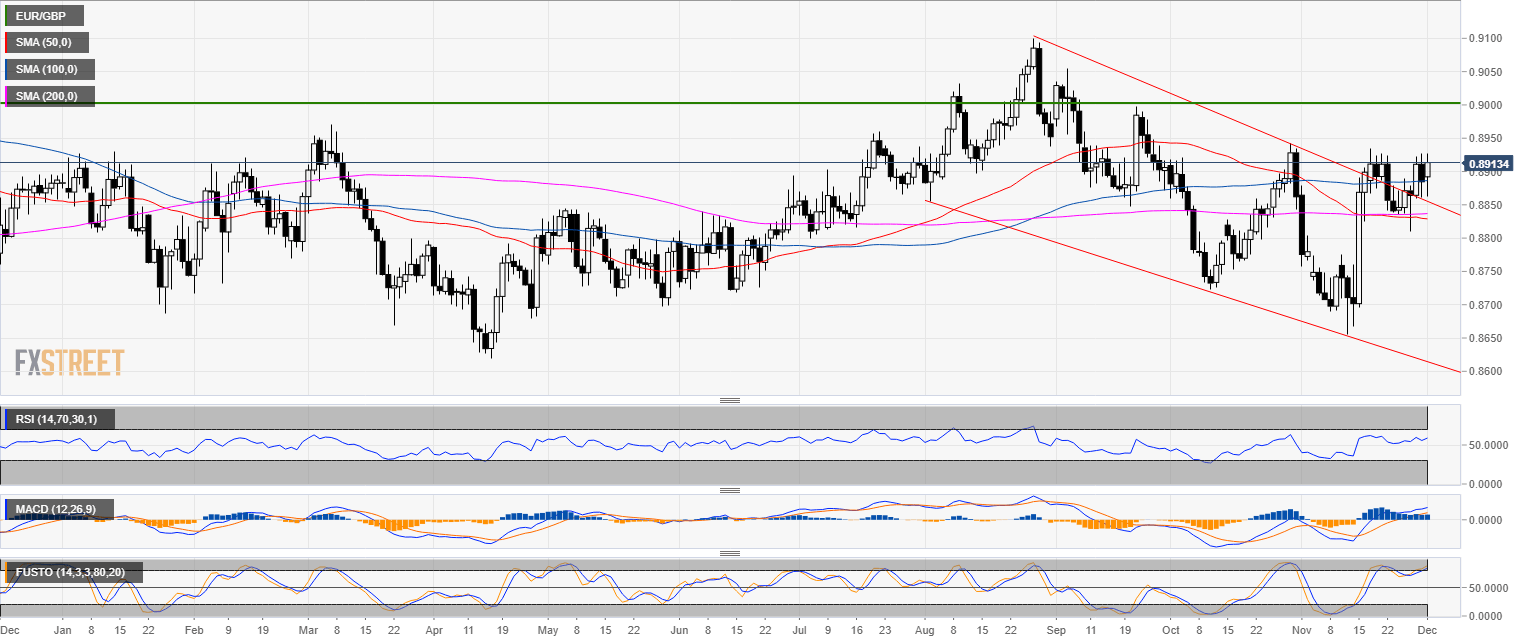
EUR/GBP daily chart
- EUR/GBP is trading in a bull trend below the 50, 100 and 200-day simple moving averages (SMAs).
- EUR/GBP is pressuring the October and November highs as bulls are targeting 0.9000 figure.
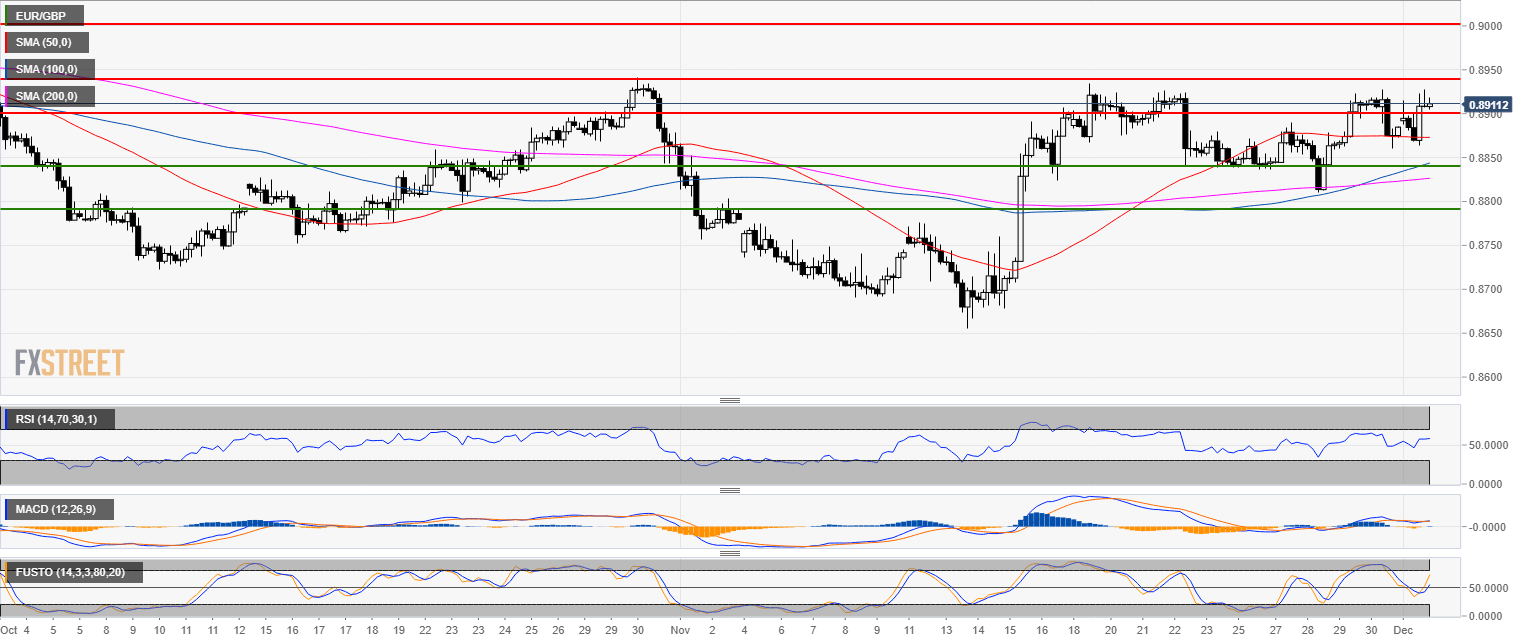
EUR/GBP 4-hour chart
- EUR/GBP bulls want to close above 0.8900 on a daily closing basis.
- 0.8929 October high is the level to beat for bulls. A break above the level should lead to a run to 0.9000 figure.
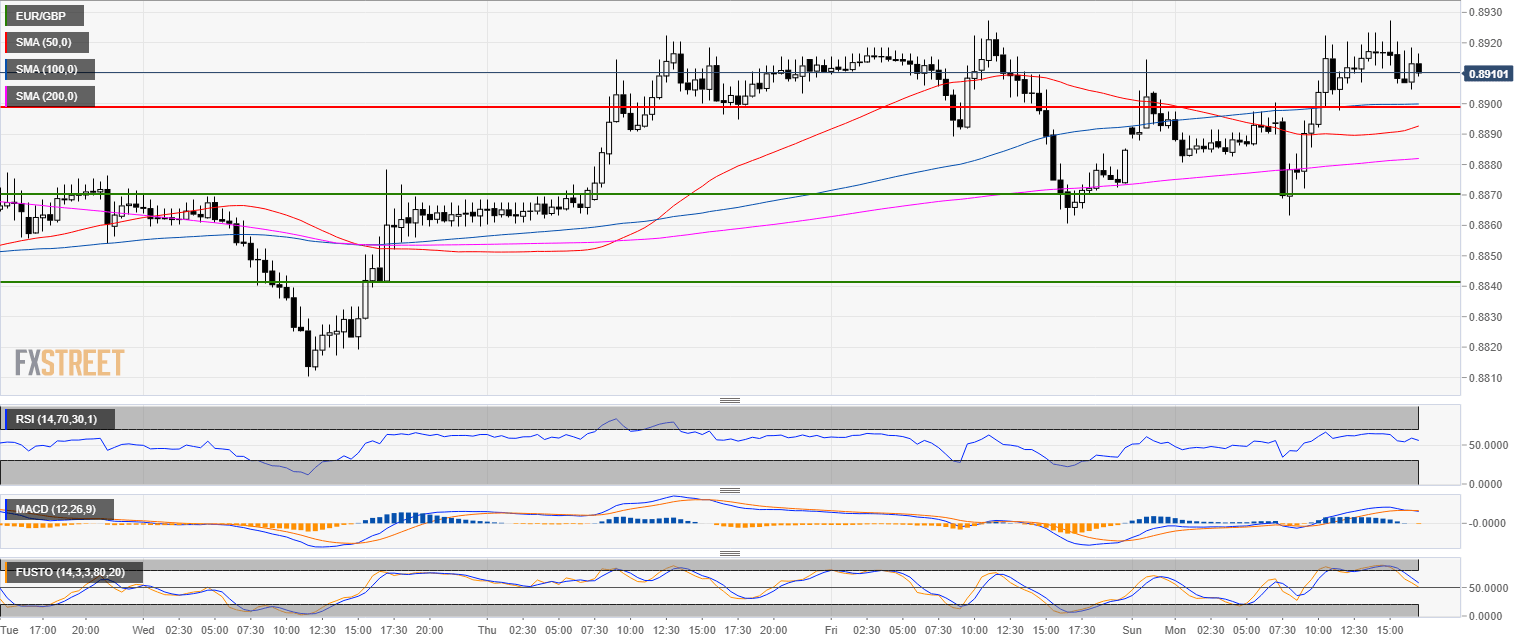
EUR/GBP 30-minute chart
- In the short-term, if bears break below 0.8900 it can lead to a pullback to the 0.8870 level.
Additional key levels
EUR/GBP
Overview:
Today Last Price: 0.8912
Today Daily change: 27 pips
Today Daily change %: 0.304%
Today Daily Open: 0.8885
Trends:
Previous Daily SMA20: 0.8816
Previous Daily SMA50: 0.883
Previous Daily SMA100: 0.8886
Previous Daily SMA200: 0.8837
Levels:
Previous Daily High: 0.8926
Previous Daily Low: 0.886
Previous Weekly High: 0.8926
Previous Weekly Low: 0.881
Previous Monthly High: 0.8932
Previous Monthly Low: 0.8656
Previous Daily Fibonacci 38.2%: 0.8885
Previous Daily Fibonacci 61.8%: 0.8901
Previous Daily Pivot Point S1: 0.8855
Previous Daily Pivot Point S2: 0.8824
Previous Daily Pivot Point S3: 0.8789
Previous Daily Pivot Point R1: 0.8921
Previous Daily Pivot Point R2: 0.8956
Previous Daily Pivot Point R3: 0.8987
