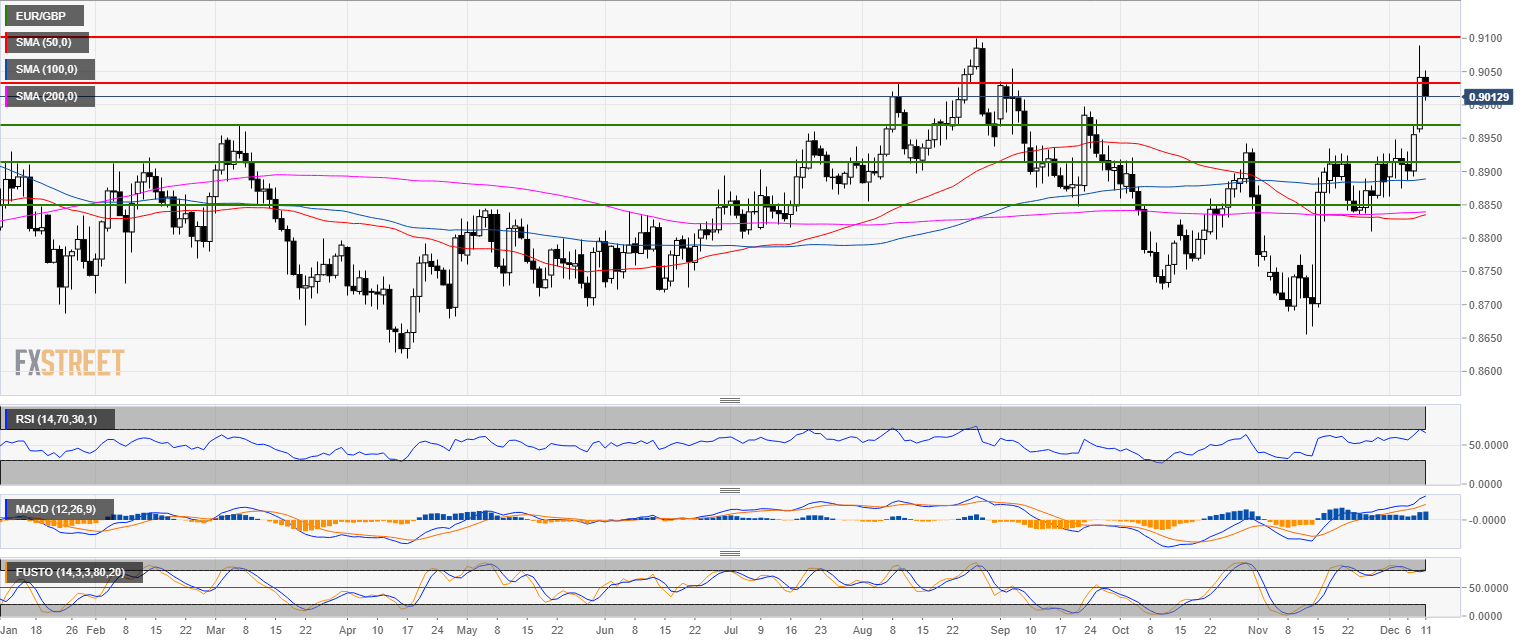
EUR/GBP daily chart
- EUR/GBP is trading in a bull trend above a flat 200-day simple moving average.
- Bulls tested the August high.
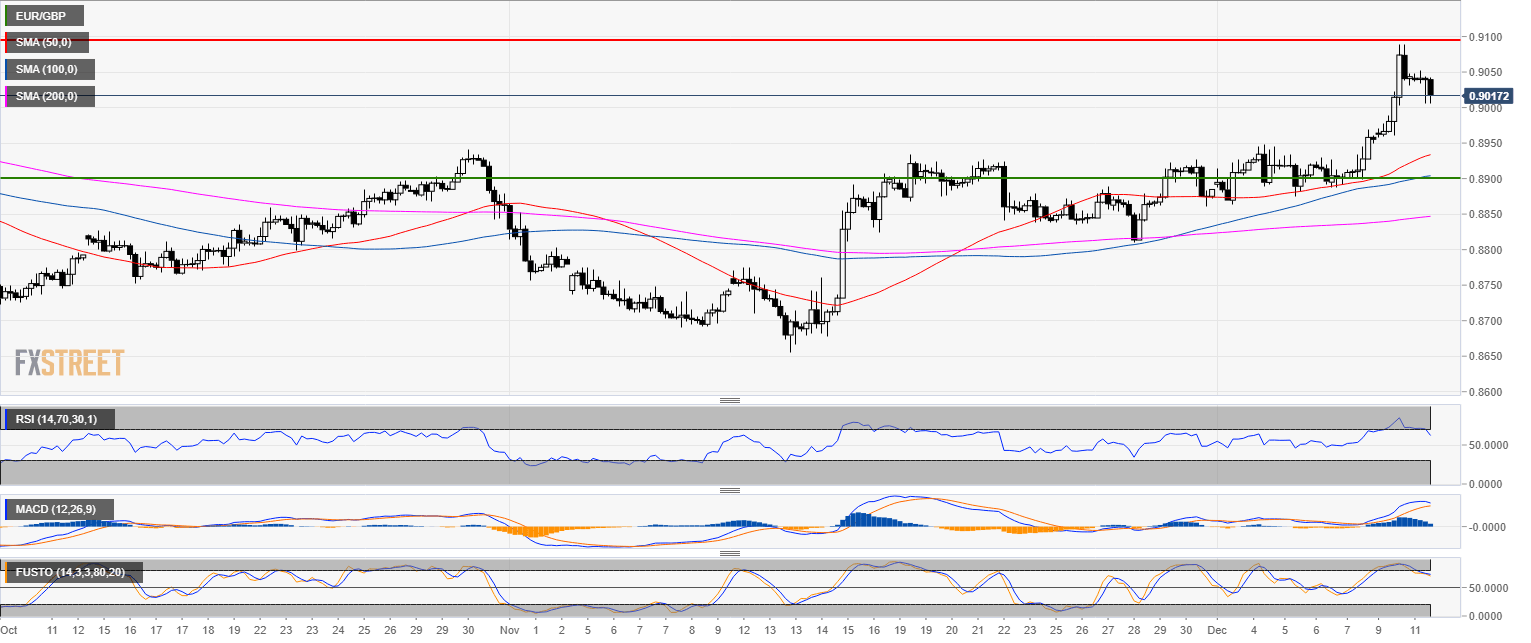
EUR/GBP 4-hour chart
- Euro bulls bumped into a strong resistance at 0.9100 figure.
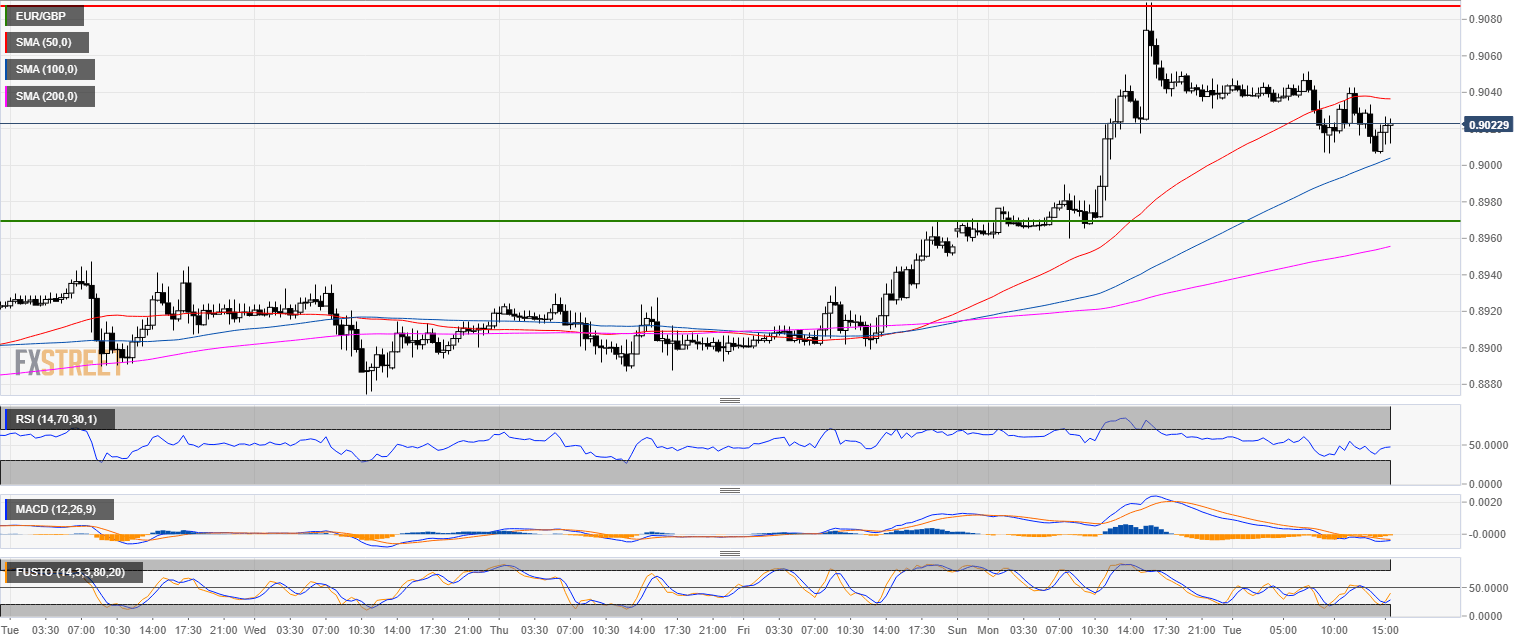
EUR/GBP 30-minute
- EUR/GBP is most likely in corrective mode after the spike up of the last 24 hours.
- Traders can expect mild support at 0.9000 as the market is likely set to trade down to the 0.8970 level next.
Additional key level
EUR/GBP
Overview:
Today Last Price: 0.9017
Today Daily change: -24 pips
Today Daily change %: -0.265%
Today Daily Open: 0.9041
Trends:
Previous Daily SMA20: 0.8881
Previous Daily SMA50: 0.8833
Previous Daily SMA100: 0.8888
Previous Daily SMA200: 0.884
Levels:
Previous Daily High: 0.9089
Previous Daily Low: 0.8958
Previous Weekly High: 0.897
Previous Weekly Low: 0.8863
Previous Monthly High: 0.8932
Previous Monthly Low: 0.8656
Previous Daily Fibonacci 38.2%: 0.9039
Previous Daily Fibonacci 61.8%: 0.9008
Previous Daily Pivot Point S1: 0.897
Previous Daily Pivot Point S2: 0.8898
Previous Daily Pivot Point S3: 0.8838
Previous Daily Pivot Point R1: 0.9101
Previous Daily Pivot Point R2: 0.9161
Previous Daily Pivot Point R3: 0.9233
