- EUR/GBP reached a new monthly low at 0.9016 this Tuesday.
- The key level to beat for bears is the 0.9020/0.9007 support zone.
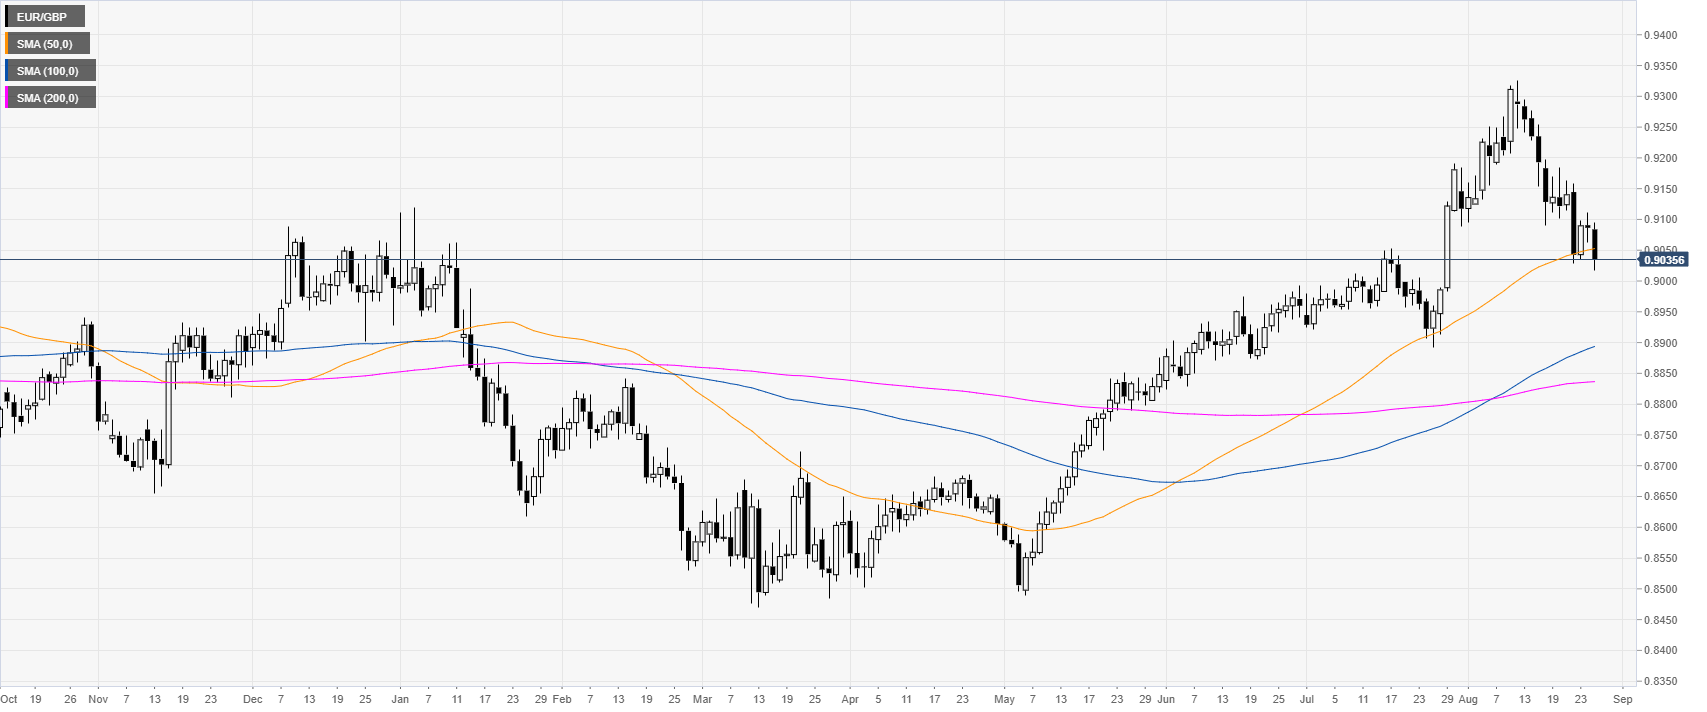
EUR/GBP daily chart
In August the market has been retracing down after peaking at the 0.9326 level. EUR/GBP almost reached the August 29, 2017 high at the 0.9307 level.
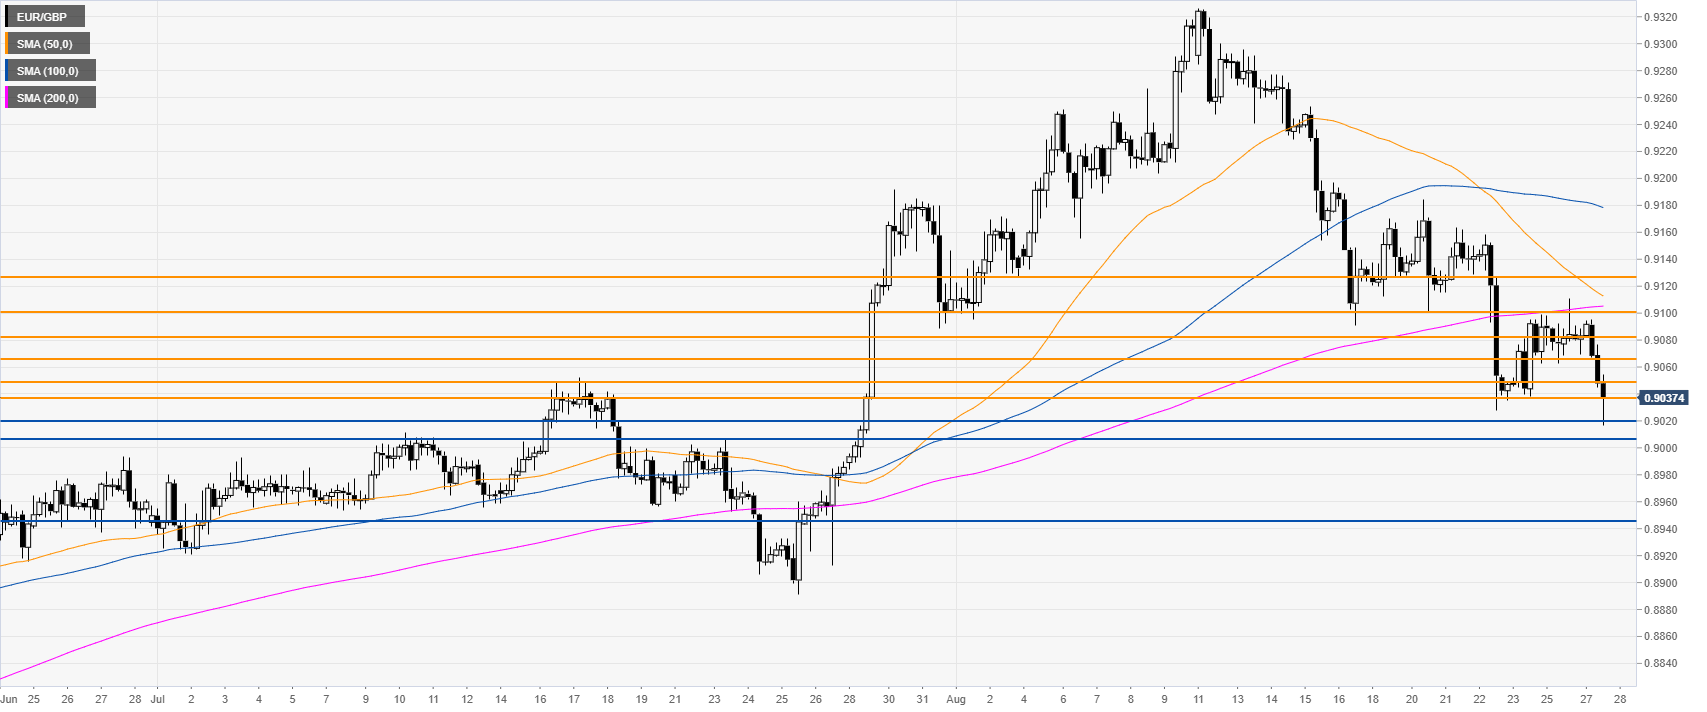
EUR/GBP 4-hour chart
The market is off the monthly lows still under bearish pressure. Sellers need a sustained break below 0.9020 and 0.9007 to generate a selloff towards 0.8945, according to the Technical Confluences Indicator.
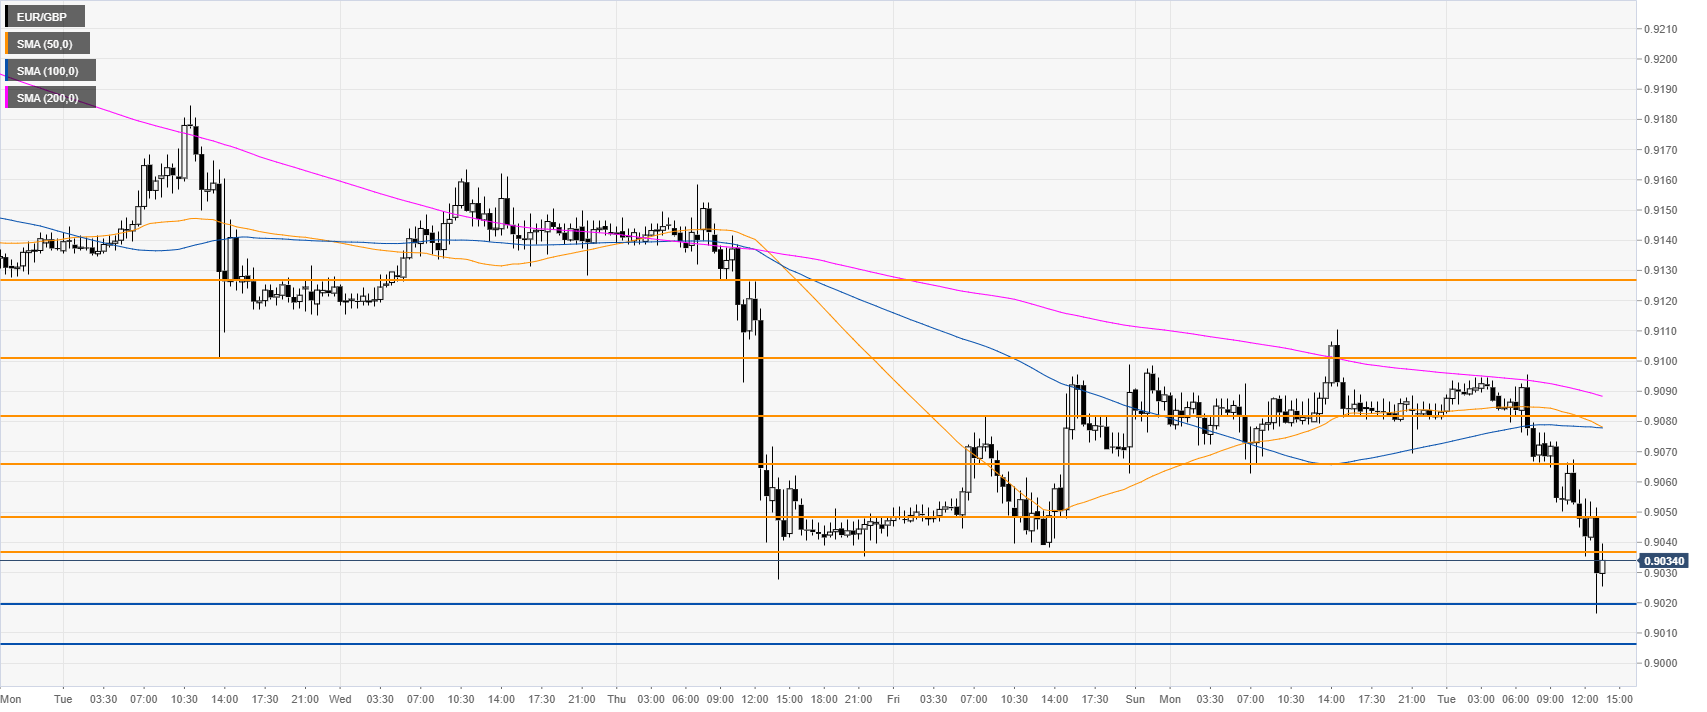
EUR/GBP 30-minute chart
EUR/GBP is trading below its main SMAs suggesting bearish momentum in the near term. Immediate resistances are seen at 0.9037, 0.9050, 0.9067 and 0.9081, according to the Technical Confluences Indicator.
Additional key levels
