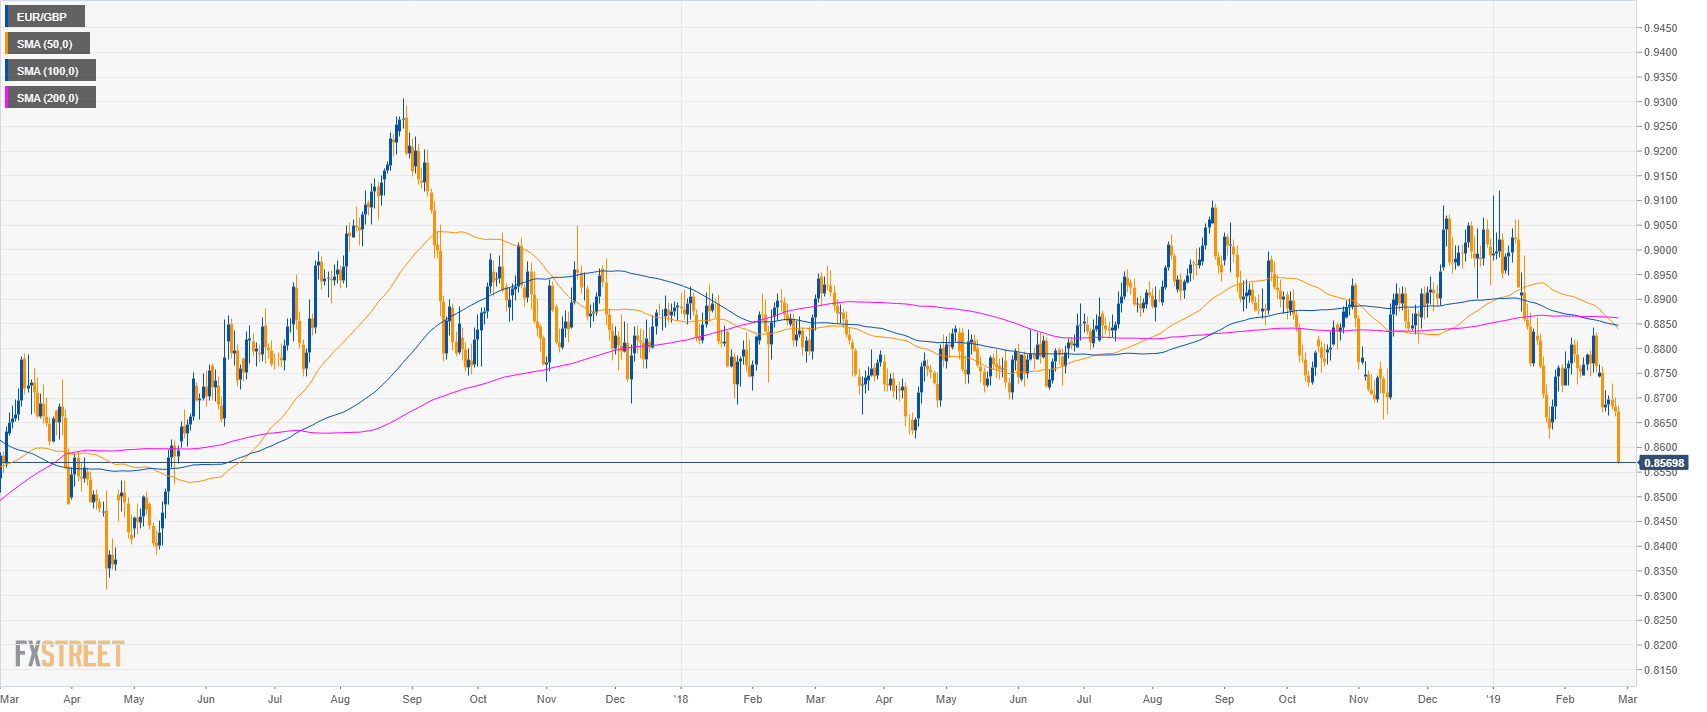
EUR/GBP daily chart
- EUR/GBP is in a sideways trend below its main simple moving averages (SMAs).
- EUR/GBP is dropping to 14-month’s low.
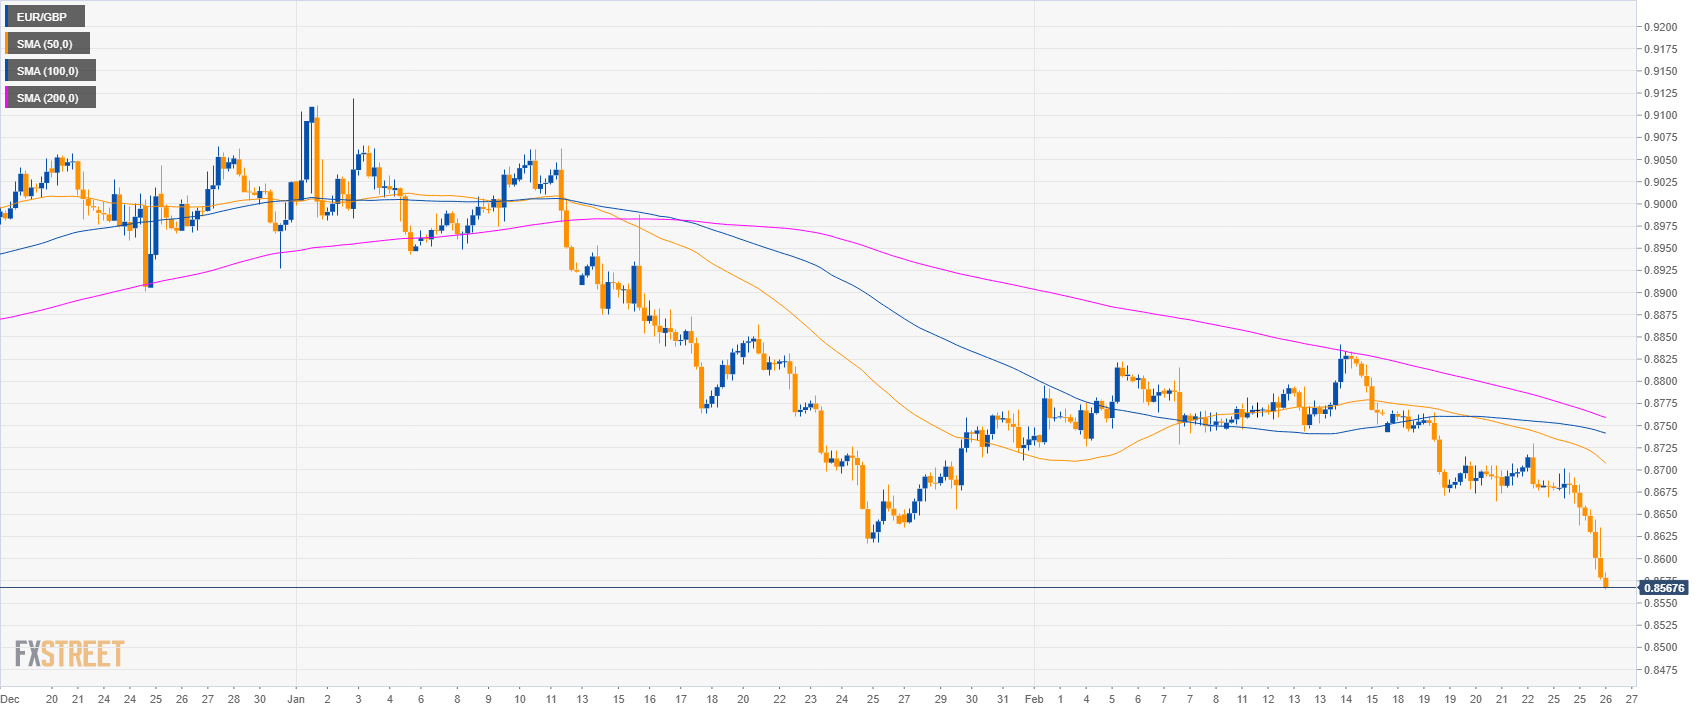
EUR/GBP 4-hour chart
- EUR/GBP is drifting down below its main SMAs suggesting bearish momentum in the medium-term.
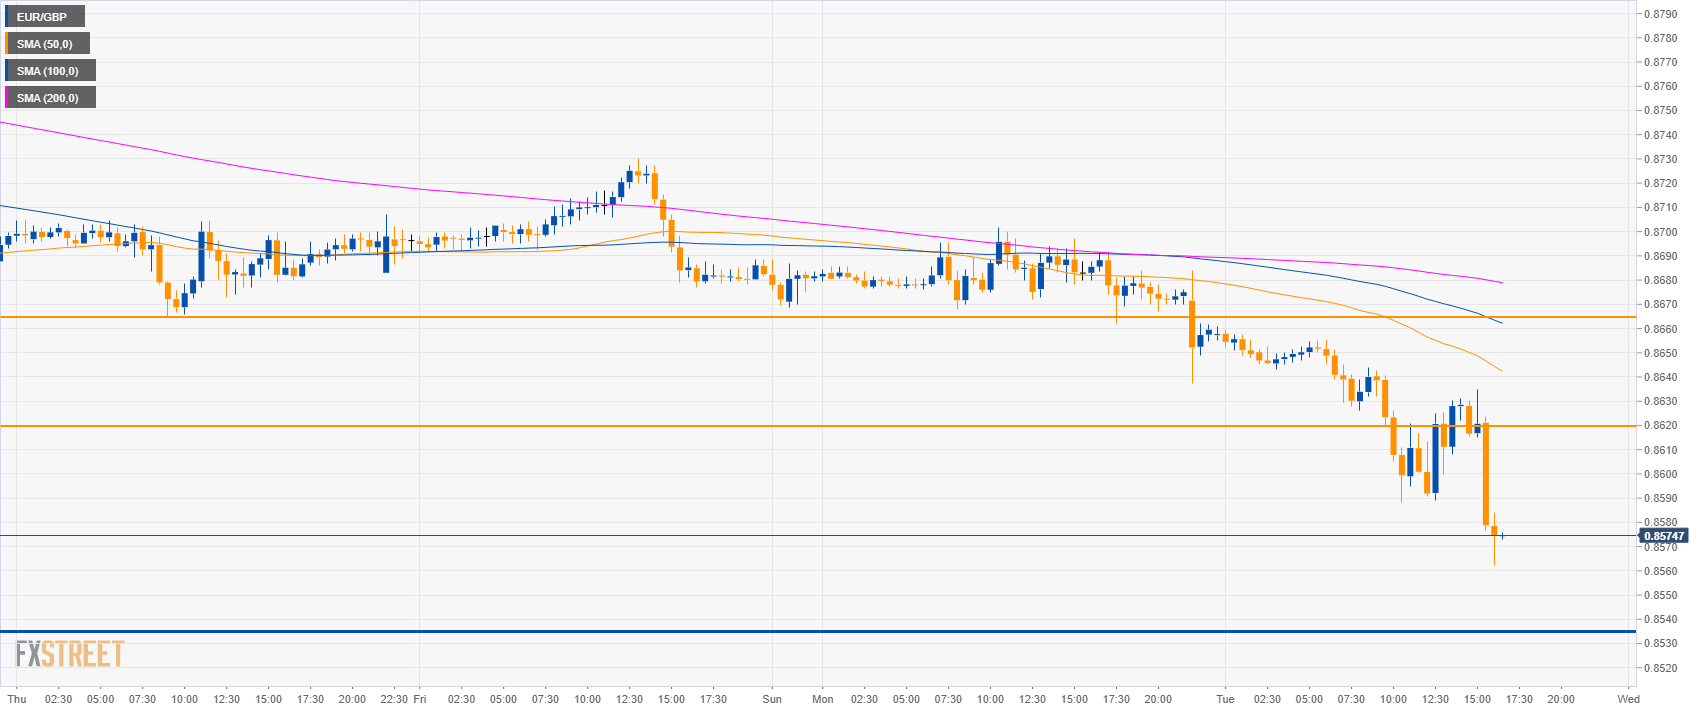
EUR/GBP 30-minute chart
- EUR/GBP is in free fall suggesting continued weakness.
- Extremely strong support is expected at 0.8530 level and investors might want to pay close attention at that price level.
- Resistance is at 0.8620 and 0.8665 level.
Additional key levels
EUR/GBP
Overview:
Today Last Price: 0.8564
Today Daily change: -108 pips
Today Daily change %: -1.25%
Today Daily Open: 0.8672
Trends:
Daily SMA20: 0.8748
Daily SMA50: 0.8848
Daily SMA100: 0.8849
Daily SMA200: 0.8863
Levels:
Previous Daily High: 0.8702
Previous Daily Low: 0.8662
Previous Weekly High: 0.8768
Previous Weekly Low: 0.8665
Previous Monthly High: 0.9119
Previous Monthly Low: 0.8617
Daily Fibonacci 38.2%: 0.8677
Daily Fibonacci 61.8%: 0.8686
Daily Pivot Point S1: 0.8655
Daily Pivot Point S2: 0.8639
Daily Pivot Point S3: 0.8616
Daily Pivot Point R1: 0.8695
Daily Pivot Point R2: 0.8718
Daily Pivot Point R3: 0.8734
