- EUR/GBP aims to revisit 23.6% Fibonacci retracement of August-December fall. August-December fall.
- A four-month-old descending trend line, 100-DMA holds the key to run-up towards 50% Fibonacci retracement.
EUR/GBP stretches the pullback from 100-Day Simple Moving Average (DMA) while taking rounds to 0.8540 ahead of Monday’s European session.
The pair now drops towards the 23.6% Fibonacci retracement level of August-December declines, at 0.8524, a break of which could recall 0.8500 mark on the chart.
It’s worth mentioning that pair’s declines below 0.8500 will highlight December 09 low near 0.8390 and the monthly bottom surrounding 0.8275 for the Bears.
On the upside, a downward sloping trend line since August 12, at 0.8630, followed by a 38.2% Fibonacci retracement level of 0.8680, could question buyers ahead of flashing lights on 100-DMA figure of 0.8740.
In a case where the Bulls govern above 0.8740, 50% and 61.8% Fibonacci retracements near 0.8800 and 0.8925 can entertain them.
EUR/GBP daily chart
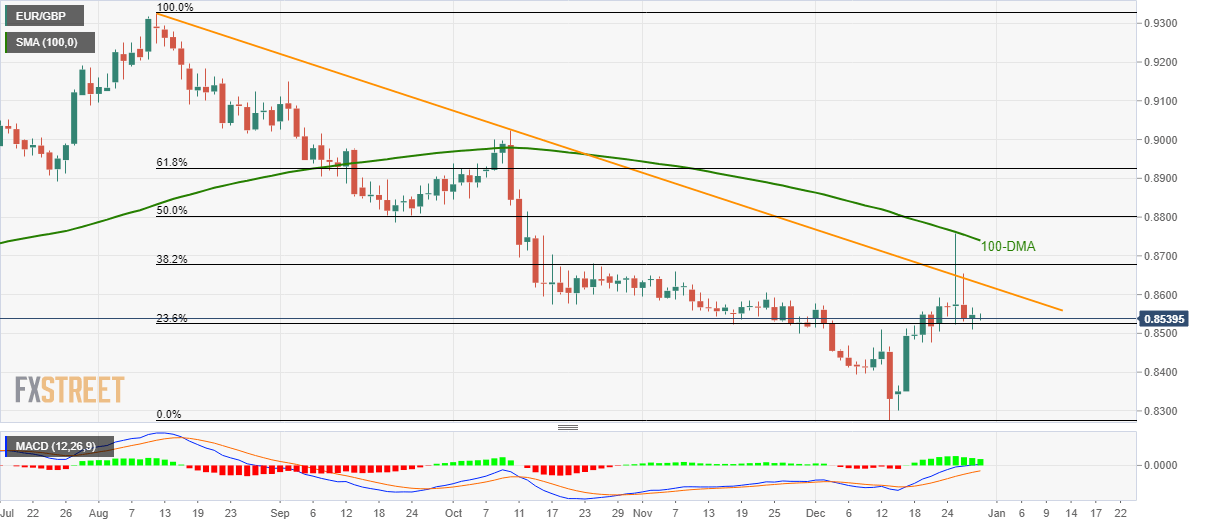
Trend: Bearish
