- The cross is falling further south of the key support level at 129.00 the figure, where coincide recent lows (July 27) and the top of the daily cloud.
- EUR/JPY is adding to recent weakness sparked after breaking below the former key support line around 130.00 the figure .
- Price action is indicative of further weakness to initially test June’s low at 126.63 ahead of 2018 lows at 124.61 seen in late May.
- Only a break above the (now) resistance line and recent peaks in the 131.20 area could allow for another visit to the 200-day SMA, today at 131.74.
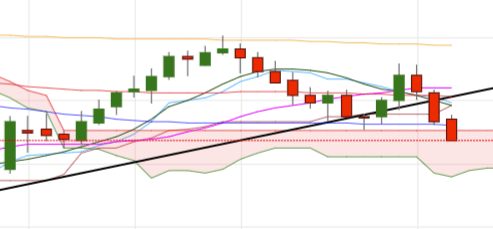
EUR/JPY daily chart
Daily high: 129.55
Daily low: 128.67
Support Levels
S1: 128.97
S2: 128.58
S3: 127.91
Resistance Levels
R1: 130.04
R2: 130.71
R3: 131.10
