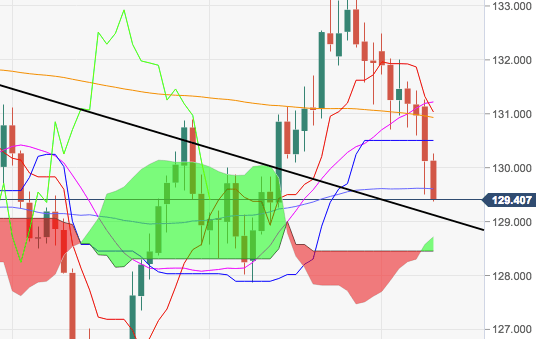
- EUR/JPY is prolonging the leg lower on Tuesday and is approaching the key 100-day SMA at 129.36 and the support line off YTD tops, today at 129.12.
- A breach of this support band could allow for a visit to September’s low at 127.86 ahead of June’s low at 126.64.
- On the upside, occasional rallies should meet strong resistance at the 200-day SMA at 130.91.
EUR/JPY daily chart
EUR/JPY
Overview:
Last Price: 129.48
Daily change: -64 pips
Daily change: -0.492%
Daily Open: 130.12
Trends:
Daily SMA20: 131.31
Daily SMA50: 129.6
Daily SMA100: 129.37
Daily SMA200: 130.99
Levels:
Daily High: 131.26
Daily Low: 129.51
Weekly High: 132.49
Weekly Low: 130.6
Monthly High: 133.15
Monthly Low: 127.87
Daily Fibonacci 38.2%: 130.18
Daily Fibonacci 61.8%: 130.59
Daily Pivot Point S1: 129.33
Daily Pivot Point S2: 128.54
Daily Pivot Point S3: 127.58
Daily Pivot Point R1: 131.09
Daily Pivot Point R2: 132.05
Daily Pivot Point R3: 132.84
