- EUR/JPY is retracing down after the October bull run.
- The level to beat for sellers is the 119.10 level.
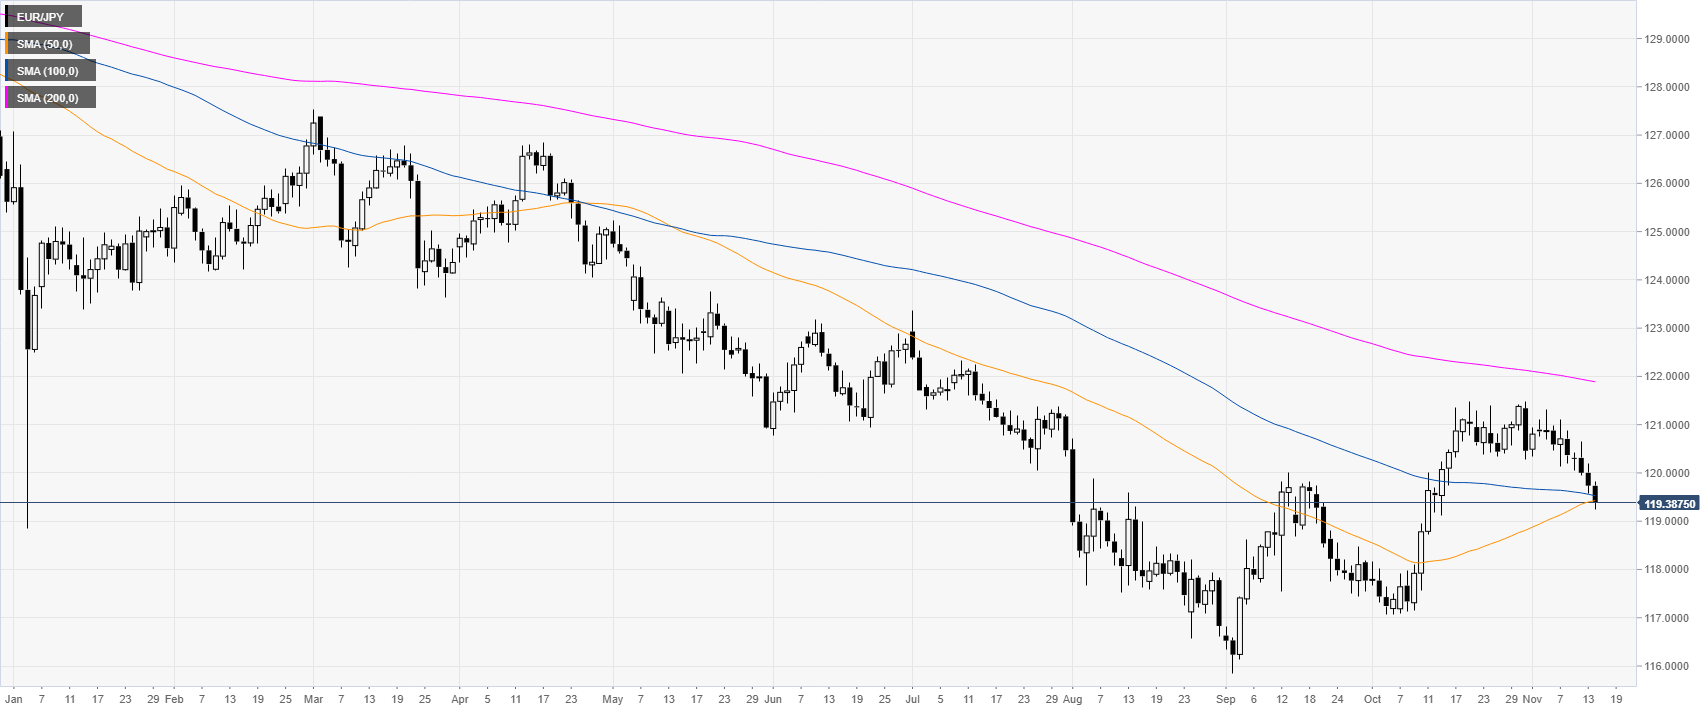
EUR/JPY daily chart
EUR/JPY is trading in a bear trend below its 200-day simple moving average (DMA). The market is correcting down after the October bull run as the price is challenging the 50 and 100 DMA near the 119.43 level.
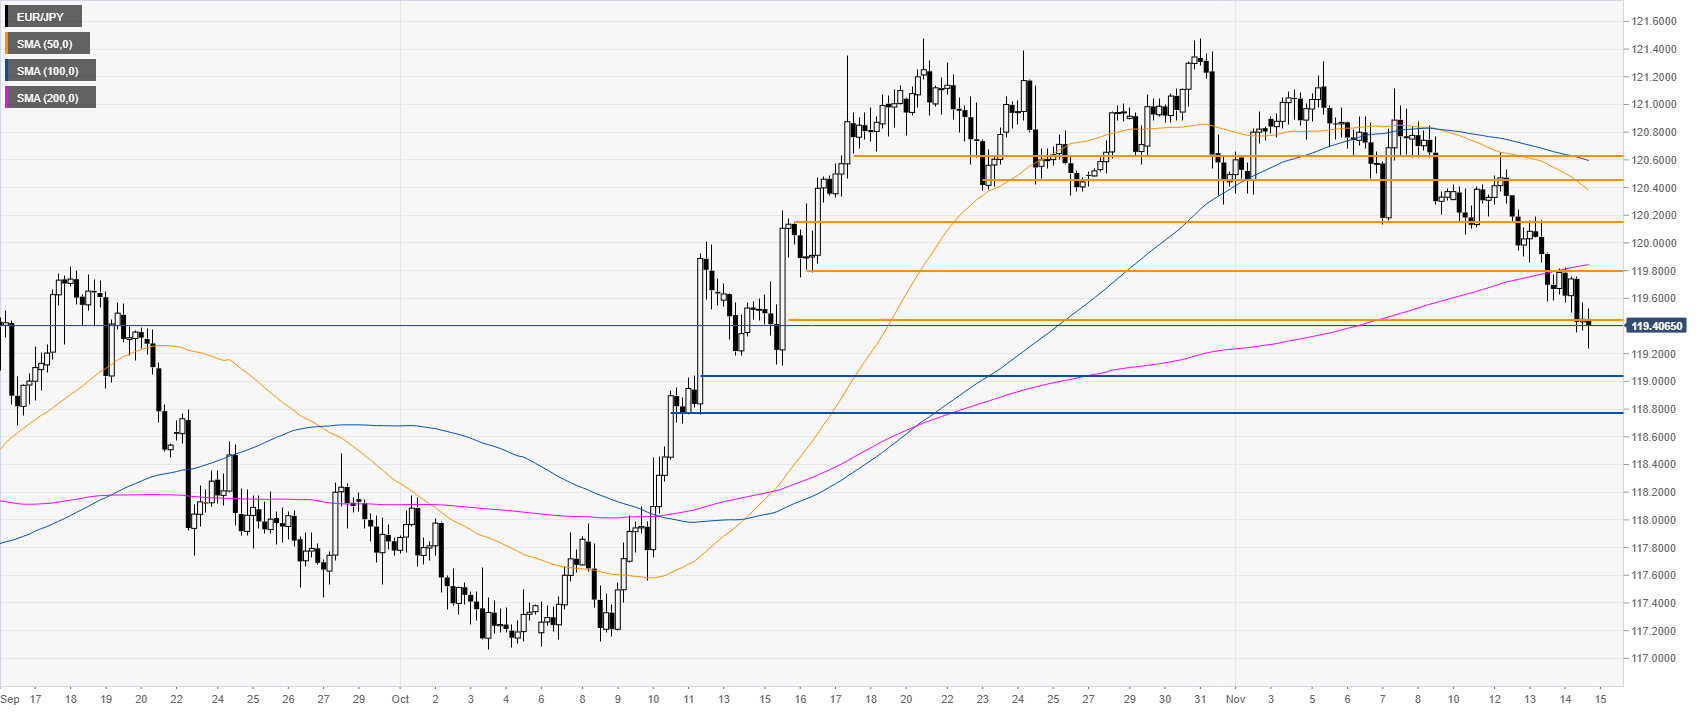
EUR/JPY four-hour chart
On the four-hour chart, the market broke below the 119.45 support and the 200 SMA, suggesting that the market is becoming weak. As the spot broke below 119.45, the market could continue to decline further towards the 119.10 and 118.77 support levels.
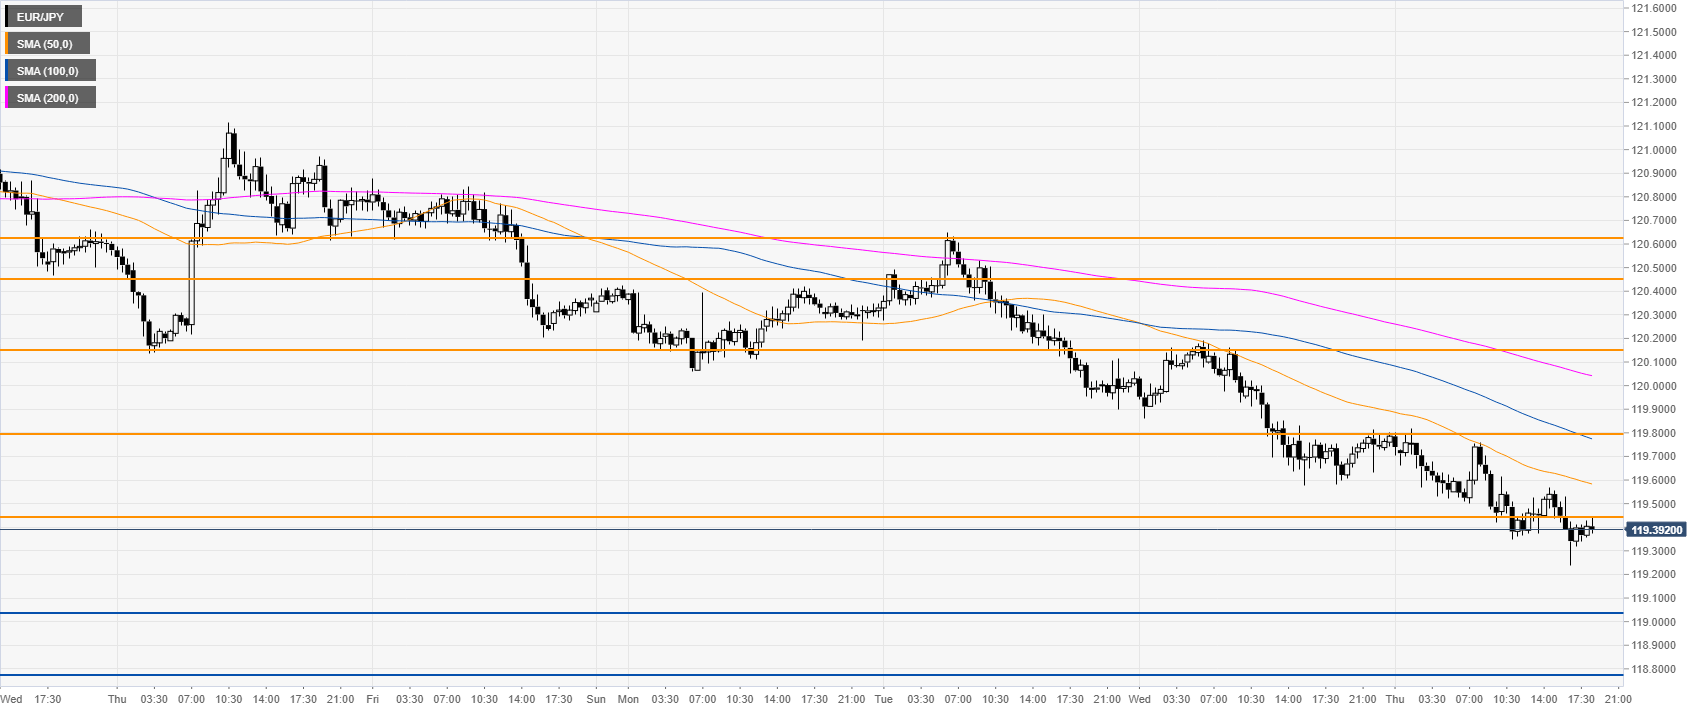
EUR/JPY 30-minute chart
The market is under pressure below the main SMAs, suggesting a bearish bias in the near term. Resistances are seen at the 119.45, 119.80 and 120.15 levels, according to the Technical Confluences Indicator.
Additional key levels
