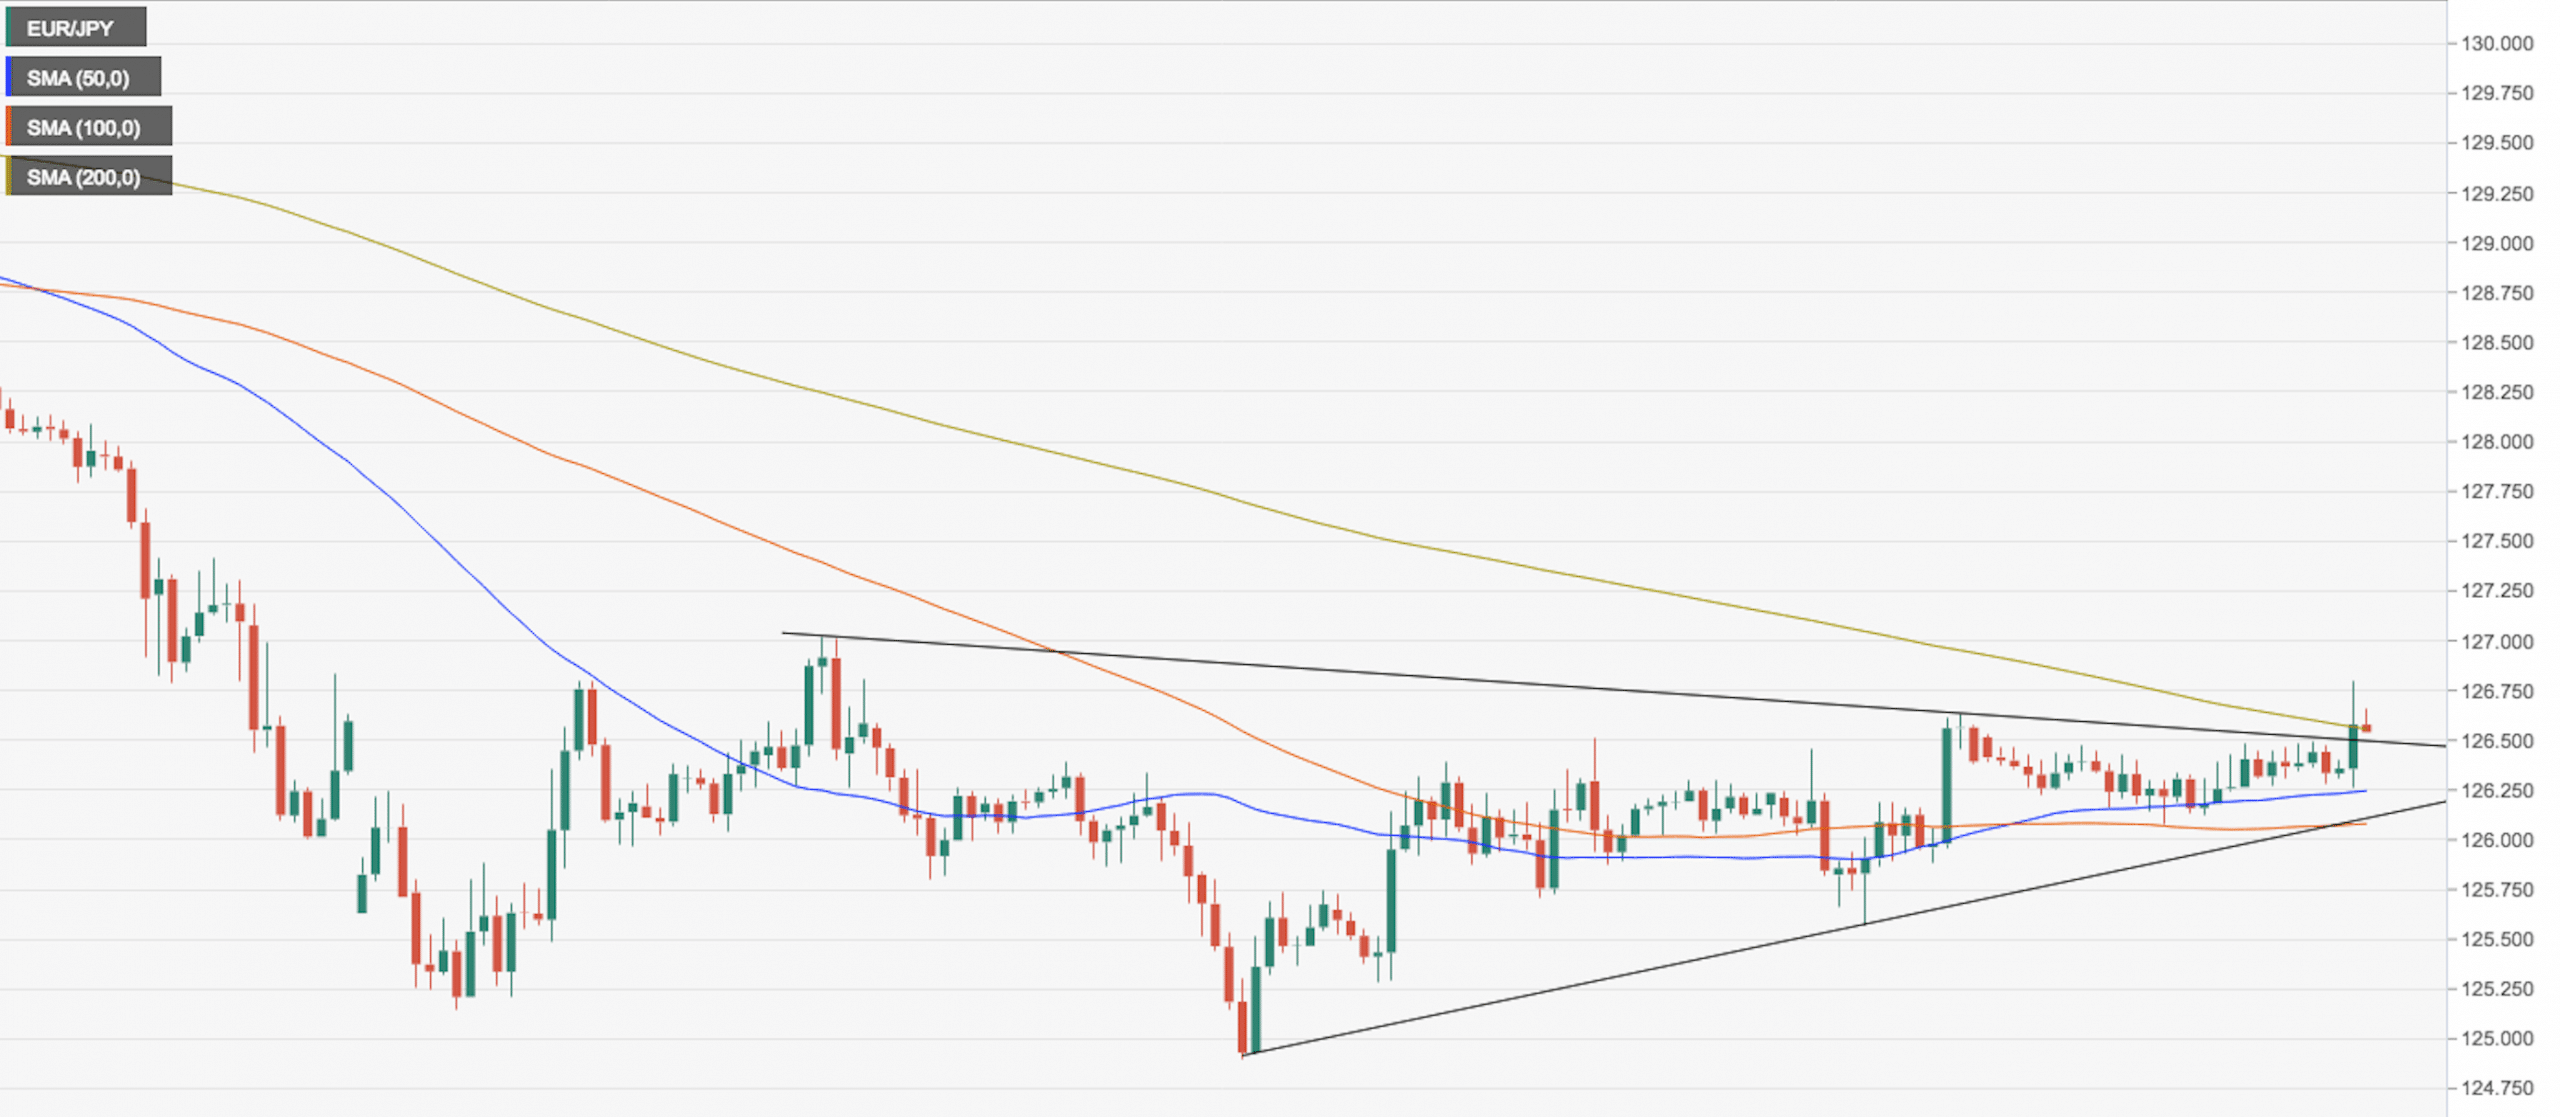
- The EUR/JPY hourly chart shows the pair has moved above the 200-hour moving average (MA) for the first time since Aug. 2.
- The chart also shows a bull pennant breakout and hence the pair could soon rise above 127.00 (psychological hurdle).
- The 50-hour MA is stationed above the 100-hour MA, signaling the path of least resistance is to the upside.
Hourly chart
Spot Rate: 126.58
Daily High: 126.77
Daily Low: 126.26
Trend: Bullish
R1: 126.68 (5-day MA)
R2: 127.48 (5-week MA)
R3: 128.00 (psychological level)
Support
S1: 126.24 (50-hour MA)
S2: 126.07 (100-hour MA)
S3: 125.58 (support as per the hourly chart)
