- EUR/JPY trades a shade lower than 126.00 during initial Asian trading on Tuesday.
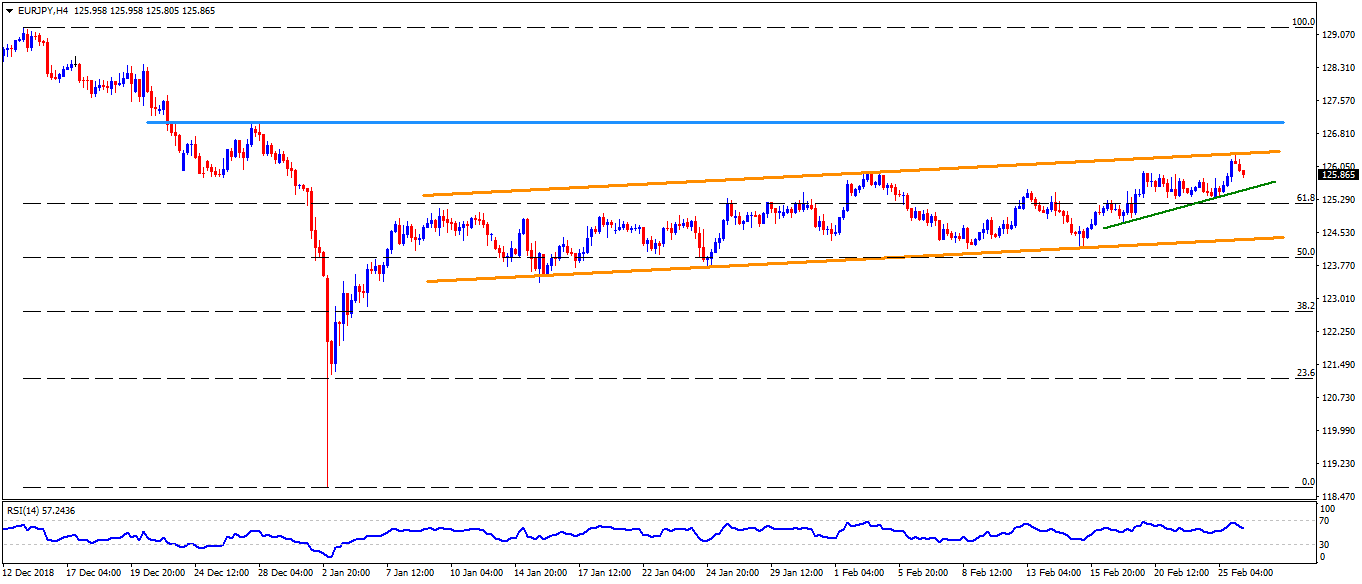
- The pair took a U-turn from an upward sloping trend-channel formation connecting the lows marked since mid-January.
- With the gradually declining 14-bar relative strength index (RSI), 125.50 level comprising an immediate ascending support-line that joins the lows of February 19 and 22 gains market attention.
- Should the pair drops under 125.50, 61.8% Fibonacci retracement of mid-December to early-January, at 125.15, followed by 124.70, can please the sellers.
- However, the channel-support figure of 124.30 might confine the pair’s downside past-124.70, if not then 123.70 and 123.40 could become bears’ favorites.
- On the flip side, an uptick beyond 126.40 channel resistance can trigger the pair’s recovery toward 127.00 – 127.10 horizontal region comprising late-December highs.
- If at all buyers refrain to respect 127.10, 127.70 and 128.40 are likely following numbers to appear on the chart.
EUR/JPY 4-Hour chart
EUR/JPY
Overview:
Today Last Price: 125.91
Today Daily change: -0.23 pips
Today Daily change %: -0.18%
Today Daily Open: 126.14
Trends:
Daily SMA20: 125.15
Daily SMA50: 125.16
Daily SMA100: 126.96
Daily SMA200: 128.16
Levels:
Previous Daily High: 126.31
Previous Daily Low: 125.38
Previous Weekly High: 125.94
Previous Weekly Low: 124.7
Previous Monthly High: 127.07
Previous Monthly Low: 118.84
Daily Fibonacci 38.2%: 125.95
Daily Fibonacci 61.8%: 125.73
Daily Pivot Point S1: 125.58
Daily Pivot Point S2: 125.01
Daily Pivot Point S3: 124.64
Daily Pivot Point R1: 126.51
Daily Pivot Point R2: 126.88
Daily Pivot Point R3: 127.45
