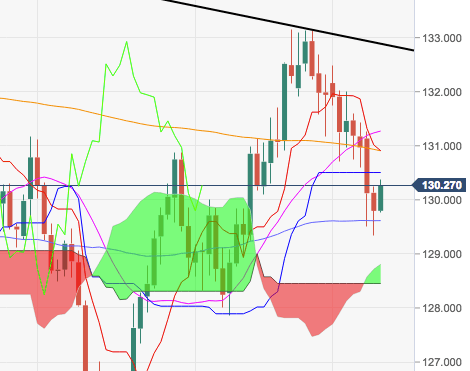
- The cross is recovering the smile after four consecutive daily pullbacks on Wednesday, managing to meet dip-buyers after testing lows in the boundaries of the key 100-day SMA in the 129.40 region on Tuesday.
- The continuation of the up move should meet the next resistance at the critical 200-day SMA at 130.89.
- Ideally, EUR/JPY needs to surpass the resistance line off 2018 tops, today at 132.88, in order to regain extra upside pressure.
EUR/JPY daily chart
EUR/JPY
Overview:
Last Price: 130.3
Daily change: 50 pips
Daily change: 0.385%
Daily Open: 129.8
Trends:
Daily SMA20: 131.32
Daily SMA50: 129.58
Daily SMA100: 129.36
Daily SMA200: 130.96
Levels:
Daily High: 130.26
Daily Low: 129.34
Weekly High: 132.49
Weekly Low: 130.6
Monthly High: 133.15
Monthly Low: 127.87
Daily Fibonacci 38.2%: 129.69
Daily Fibonacci 61.8%: 129.9
Daily Pivot Point S1: 129.34
Daily Pivot Point S2: 128.88
Daily Pivot Point S3: 128.42
Daily Pivot Point R1: 130.26
Daily Pivot Point R2: 130.72
Daily Pivot Point R3: 131.18
