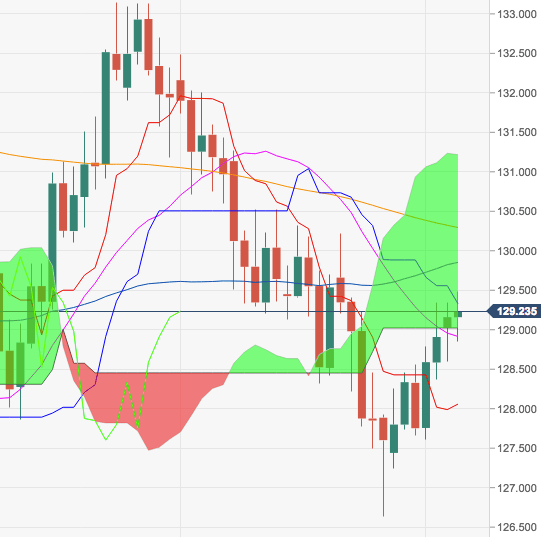
- The cross is struggling for direction above the 129.00 handle on Tuesday, so far finding resistance around the 100-day SMA in the mid-129.00s.
- Further upside should see the 55-day SMA at 129.87 tested, ahead of the more relevant 200-day SMA at 130.27.
- The resumption of the bearish bias should meet interim support in the 10-day SMA at 128.32 ahead of October’s low at 126.61 (October 26).
EUR/JPY daily chart
EUR/JPY
Overview:
Last Price: 129.26
Daily change: 10 pips
Daily change: 0.0774%
Daily Open: 129.16
Trends:
Daily SMA20: 128.9
Daily SMA50: 129.94
Daily SMA100: 129.45
Daily SMA200: 130.35
Levels:
Daily High: 129.34
Daily Low: 128.6
Weekly High: 129.34
Weekly Low: 127.24
Monthly High: 132.49
Monthly Low: 126.63
Daily Fibonacci 38.2%: 129.06
Daily Fibonacci 61.8%: 128.89
Daily Pivot Point S1: 128.73
Daily Pivot Point S2: 128.29
Daily Pivot Point S3: 127.98
Daily Pivot Point R1: 129.47
Daily Pivot Point R2: 129.78
Daily Pivot Point R3: 130.21
