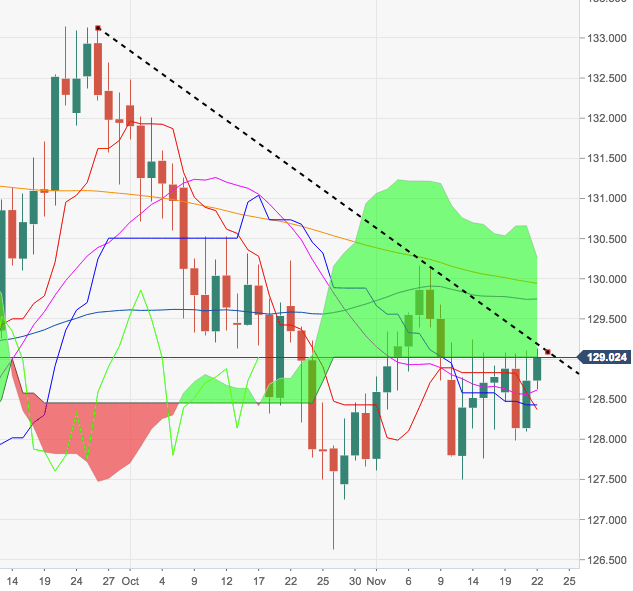
- The cross is extending the up move today and is eroding the critical resistance line above 129.00 the figure, where is also located the base of the daily cloud and recent failed bullish attempts.
- EUR/JPY needs to overcome this area on a sustainable fashion to allow for extra upside to, initially, the 55-day SMA (129.76) ahead of the more relevant 200-day SMA, at 129.94.
- Further north lies November’s peaks in the 130.15/20 band.
EUR/JPY daily chart
EUR/JPY
Overview:
Last Price: 129.02
Daily change: 29 pips
Daily change: 0.225%
Daily Open: 128.73
Trends:
Daily SMA20: 128.59
Daily SMA50: 129.82
Daily SMA100: 129.52
Daily SMA200: 129.98
Levels:
Daily High: 129.1
Daily Low: 128.1
Weekly High: 129.24
Weekly Low: 127.5
Monthly High: 132.49
Monthly Low: 126.63
Daily Fibonacci 38.2%: 128.72
Daily Fibonacci 61.8%: 128.48
Daily Pivot Point S1: 128.18
Daily Pivot Point S2: 127.64
Daily Pivot Point S3: 127.18
Daily Pivot Point R1: 129.19
Daily Pivot Point R2: 129.65
Daily Pivot Point R3: 130.19
