EUR/JPY has created a falling wedge – a bullish reversal pattern – on the 4-hour chart.
A move above the upper edge of the wedge, currently at 126.38, would confirm a breakout and open the doors to re-test of recent highs near 127.50. On the way higher, the pair may encounter resistance at 126.94 (March 5 high).
The breakout, however, may remain elusive or could end up trapping the bulls on the wrong side of the market if the European Central Bank introduces another dovish tweak to its forward guidance, having acknowledged in December that balance of risks is growing to the downside and revises growth forecasts significantly lower.
4-hour chart
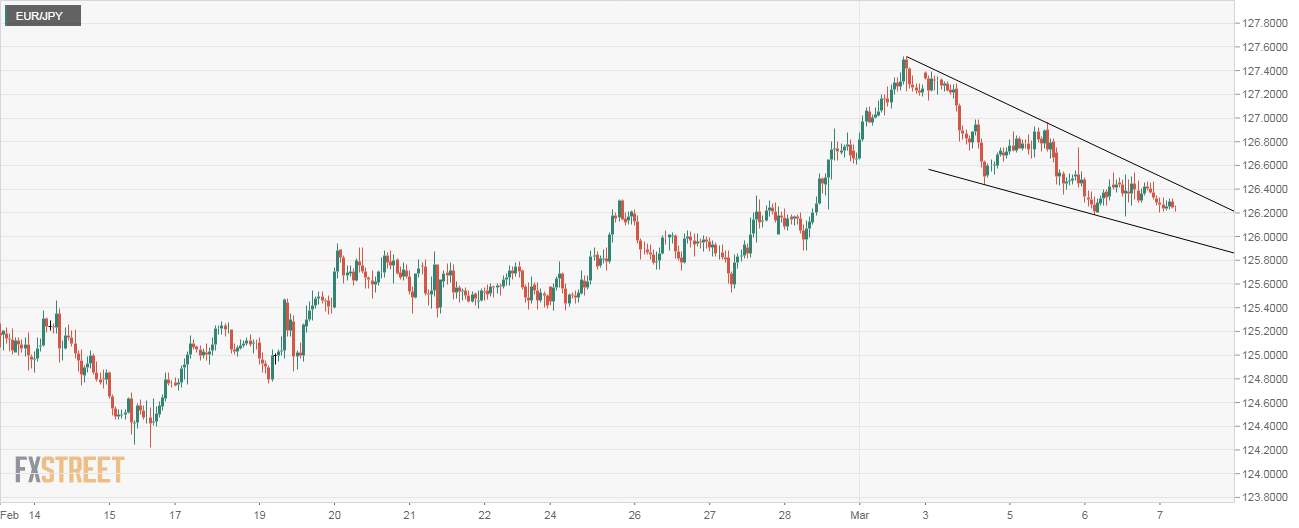
Trend: Bullish above 126.38
EUR/JPY
Overview:
Today Last Price: 126.23
Today Daily change: -18 pips
Today Daily change %: -0.14%
Today Daily Open: 126.41
Trends:
Daily SMA20: 125.62
Daily SMA50: 125.11
Daily SMA100: 126.74
Daily SMA200: 128.12
Levels:
Previous Daily High: 126.75
Previous Daily Low: 126.16
Previous Weekly High: 127.52
Previous Weekly Low: 125.38
Previous Monthly High: 126.92
Previous Monthly Low: 124.16
Daily Fibonacci 38.2%: 126.39
Daily Fibonacci 61.8%: 126.53
Daily Pivot Point S1: 126.13
Daily Pivot Point S2: 125.86
Daily Pivot Point S3: 125.55
Daily Pivot Point R1: 126.72
Daily Pivot Point R2: 127.03
Daily Pivot Point R3: 127.3
