EUR/USD has been advancing after disappointing US data weighed on the Dollar. Can the world’s most popular currency pair continue higher?
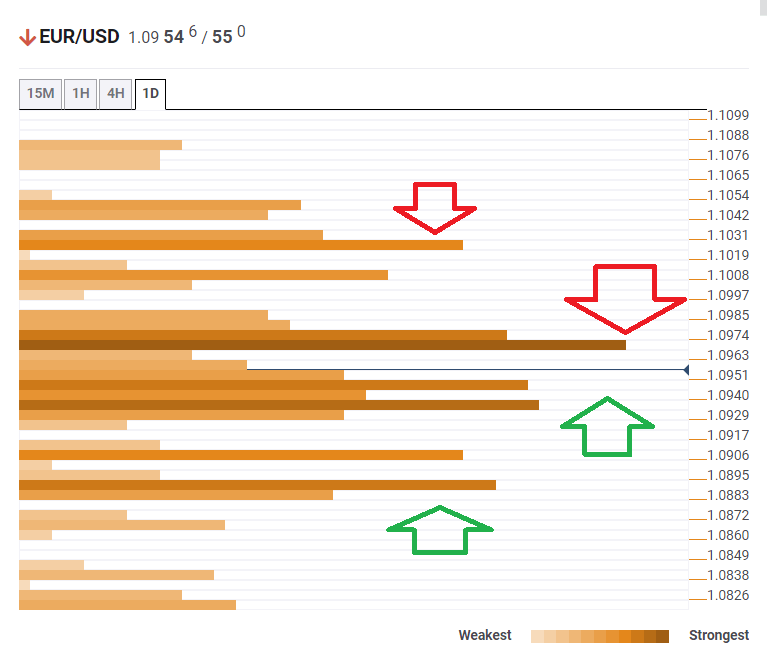
The Technical Confluences Indicator is showing that EUR/USD faces fierce resistance at 1.0968, which is a dense cluster of lines including the previous daily high, the Simple Moving Average 10-one-day, the Fibonacci 38.2% one-month, and the Bollinger Band four-hour Upper.
If it breaks higher, the upside target is 1.1025, which is the convergence of the Fibonacci 61.8% one-month and the SMA 200-4h.
Looking down, support awaits at around 1.0940, where we see the confluence of the Fibonacci 38.2% one-day, the SMA 10-4h, the Fibonacci 23.6% one-month, the BB one-hour Lower, the SMA 50-1h, the SMA 5-1d, and the Fibonacci 23.6% one-week.
Further down, significant support awaits at 1.0888, which is the meeting point of the previous monthly low and the Pivot Point one-week Support 1.
Here is how it looks on the tool:
Confluence Detector
The Confluence Detector finds exciting opportunities using Technical Confluences. The TC is a tool to locate and point out those price levels where there is a congestion of indicators, moving averages, Fibonacci levels, Pivot Points, etc. Knowing where these congestion points are located is very useful for the trader, and can be used as a basis for different strategies.
This tool assigns a certain amount of “weight” to each indicator, and this “weight” can influence adjacents price levels. These weightings mean that one price level without any indicator or moving average but under the influence of two “strongly weighted” levels accumulate more resistance than their neighbors. In these cases, the tool signals resistance in apparently empty areas.
Learn more about Technical Confluence
