- EURUSD’s daily chart shows a bullish-to-bearish trend change.
- The pair risks extending the recent decline from 1.22.
EUR/USD closed 1.2049 on Tuesday, confirming a head-and-shoulders bearish reversal pattern on the daily chart.
The breakdown is backed by a below-50 or bearish reading on the 14-day Relative Strength Index and has created room for a sell-off to 1.1750 (target as per the measured move method).
However, Tuesday’s candle carries a long lower wick, a sign of seller fatigue. As such, the pair could consolidate the near the neckline level near 1.2049 before charting deeper losses.
A close above Tuesday’s high of 1.2088 would invalidate the bearish pattern.
Daily chart
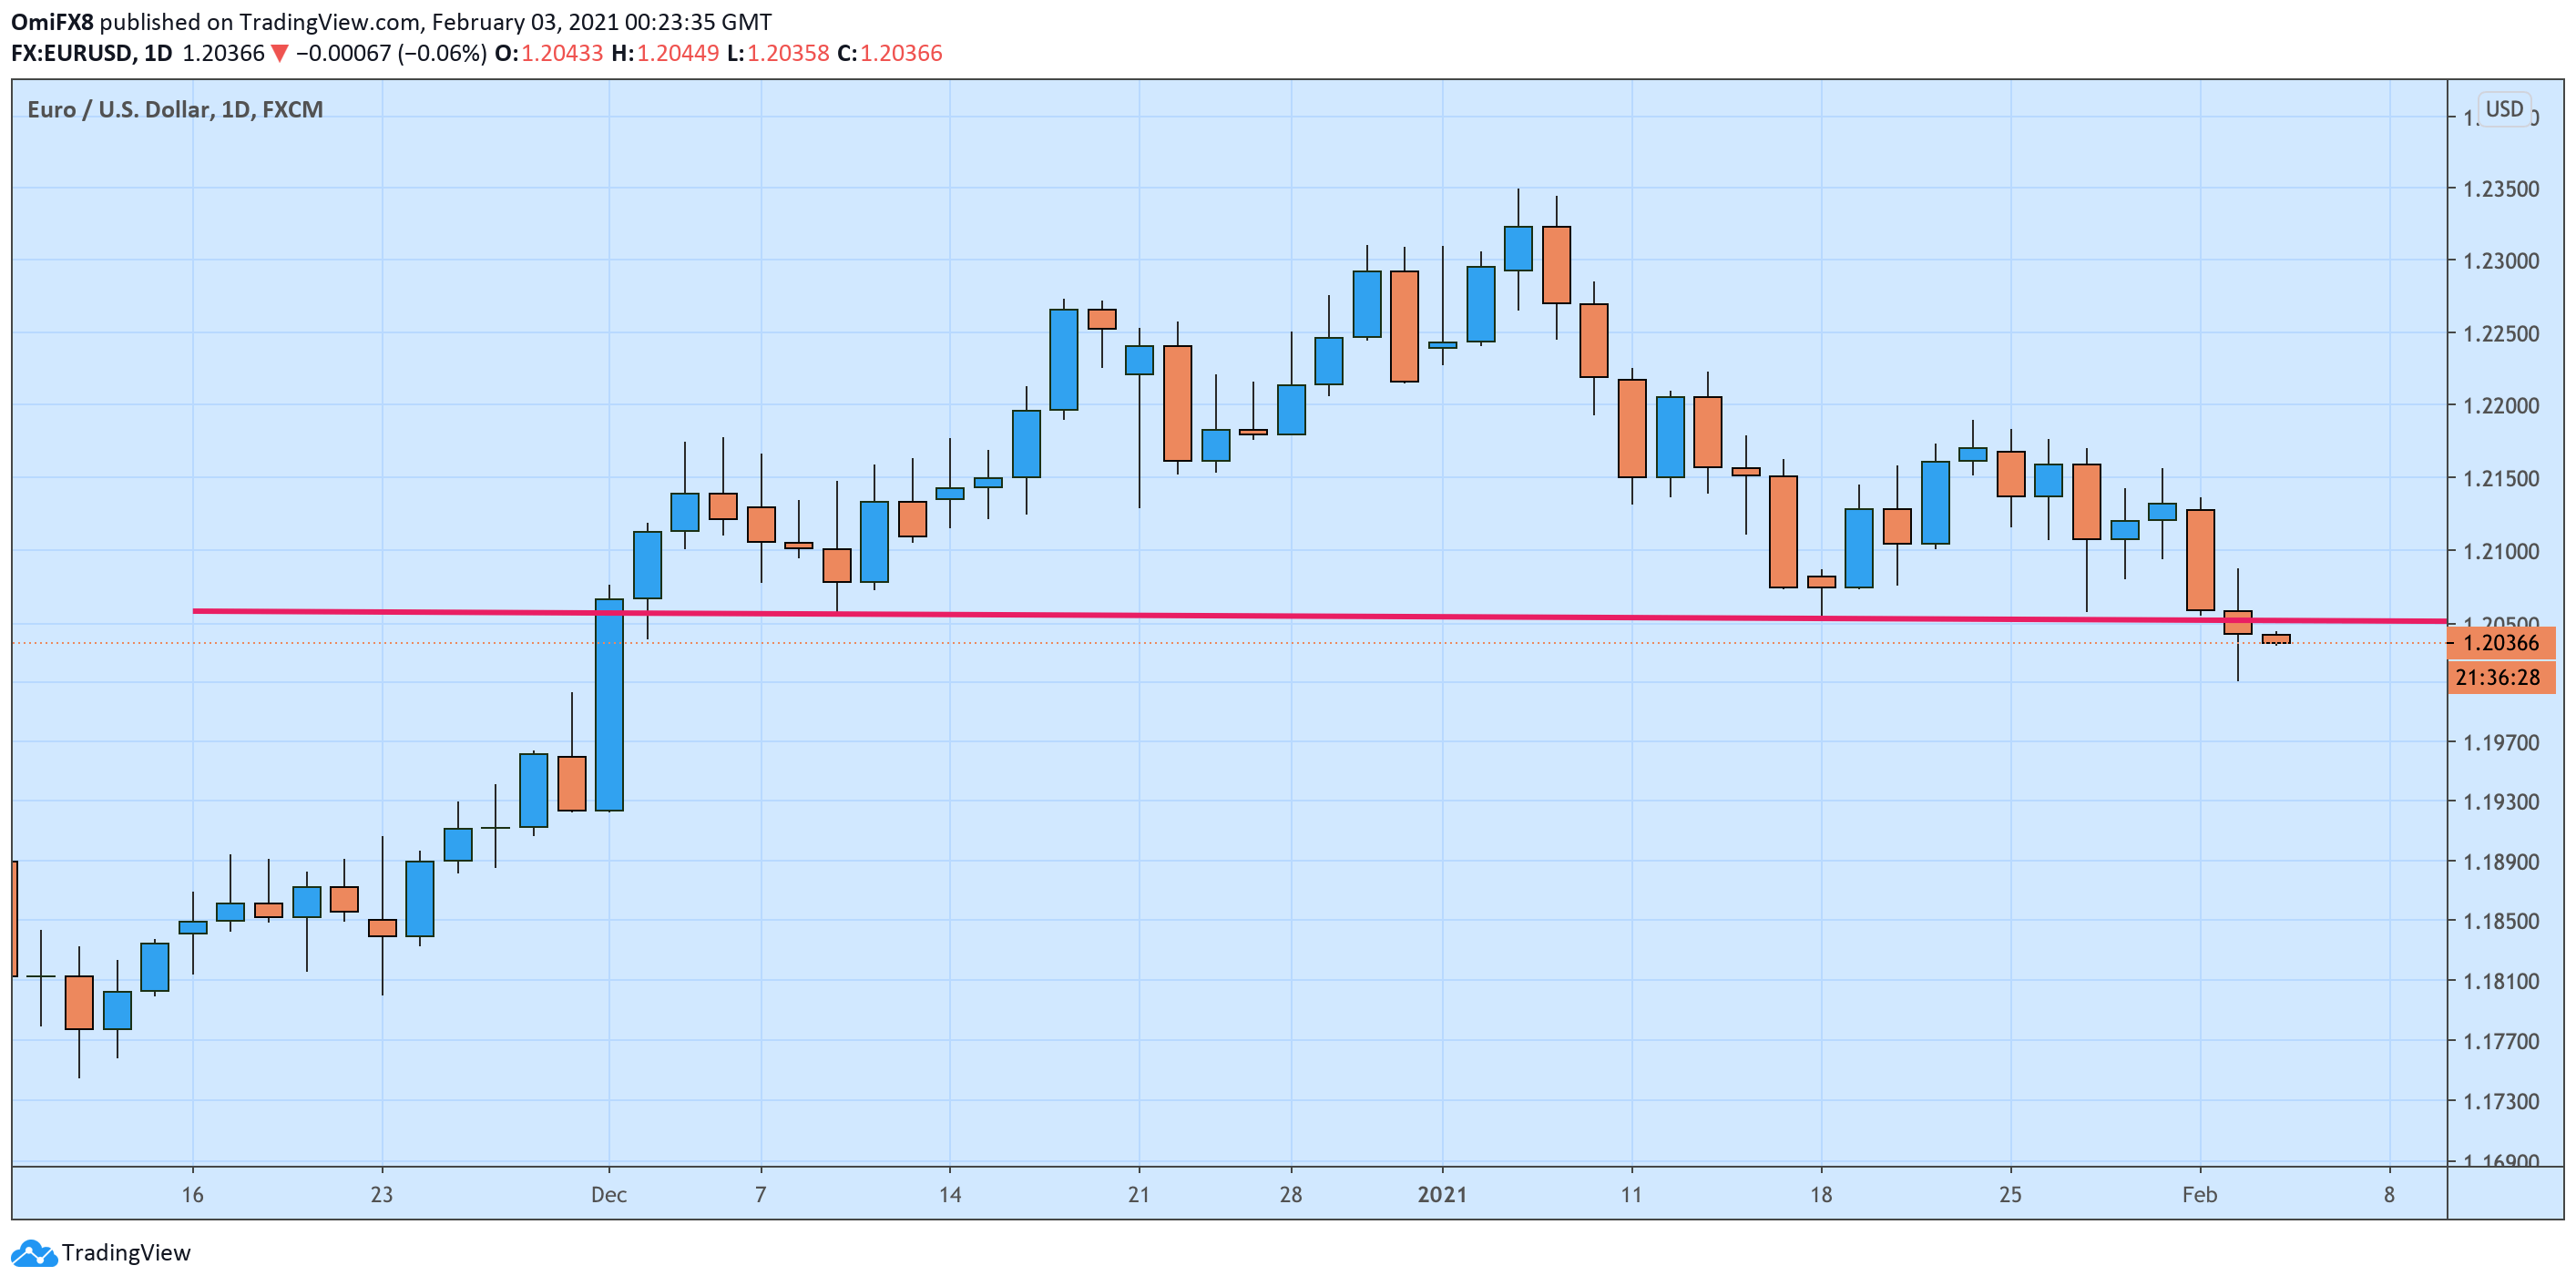
Trend: Bearish
Technical levels
