- EUR/USD prints a three-day losing streak and hits two-week low.
- Short-term indicators turn bearish, signaling scope for deeper losses.
EUR/USD fell for the third straight trading day on Monday, confirming its longest daily losing trend since the end of October.
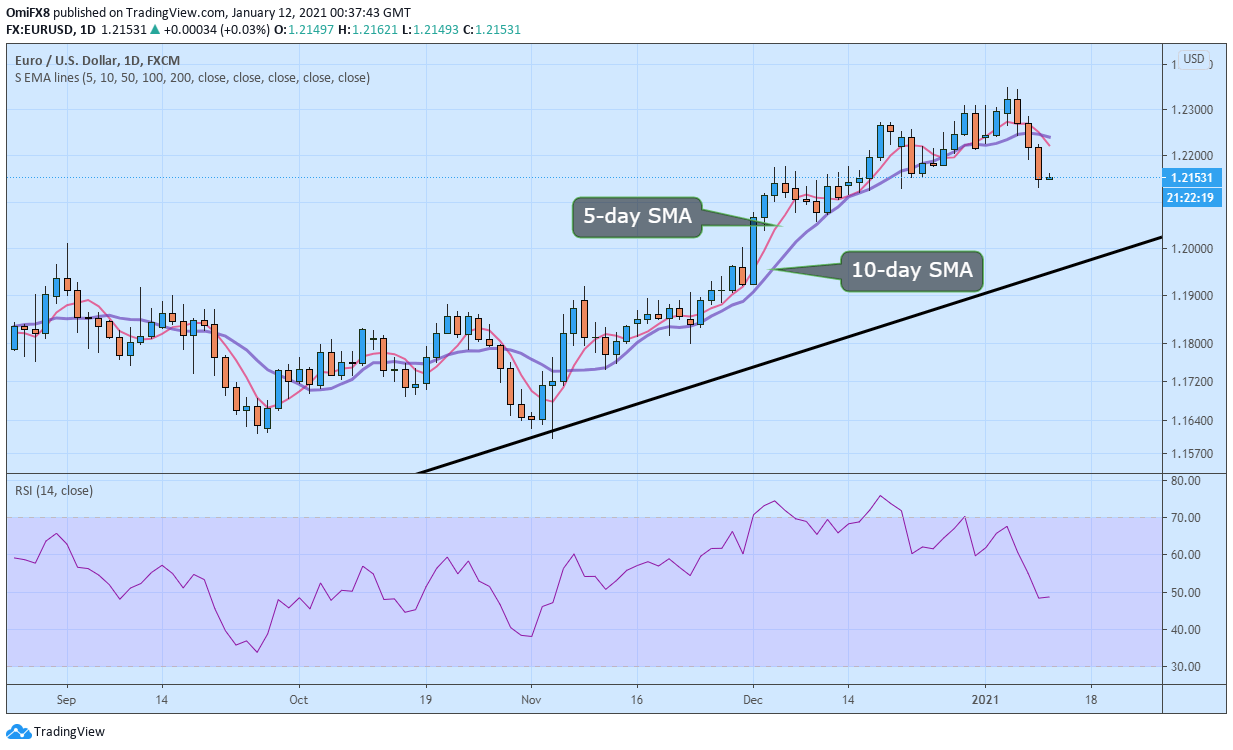
The daily chart shows momentum studies are rolling over in favor of the bears, with the 5-day Simple Moving Average (SMA) looking to cross below the 10-day SMA. The 14-day Relative Strength Index has dipped into a bearish territory below 5.
These indicators support the bearish picture painted by the rising wedge breakdown confirmed on Friday. As such, the pair appears on track test support at 1.2059 (Dec. 9 low). At press time, EUR/USD is sidelined near 1.2152.
A close above the 10-day SMA at 1.2241 is needed to invalidate the bearish bias.
Daily chart
Trend: Bearish
Technical levels
