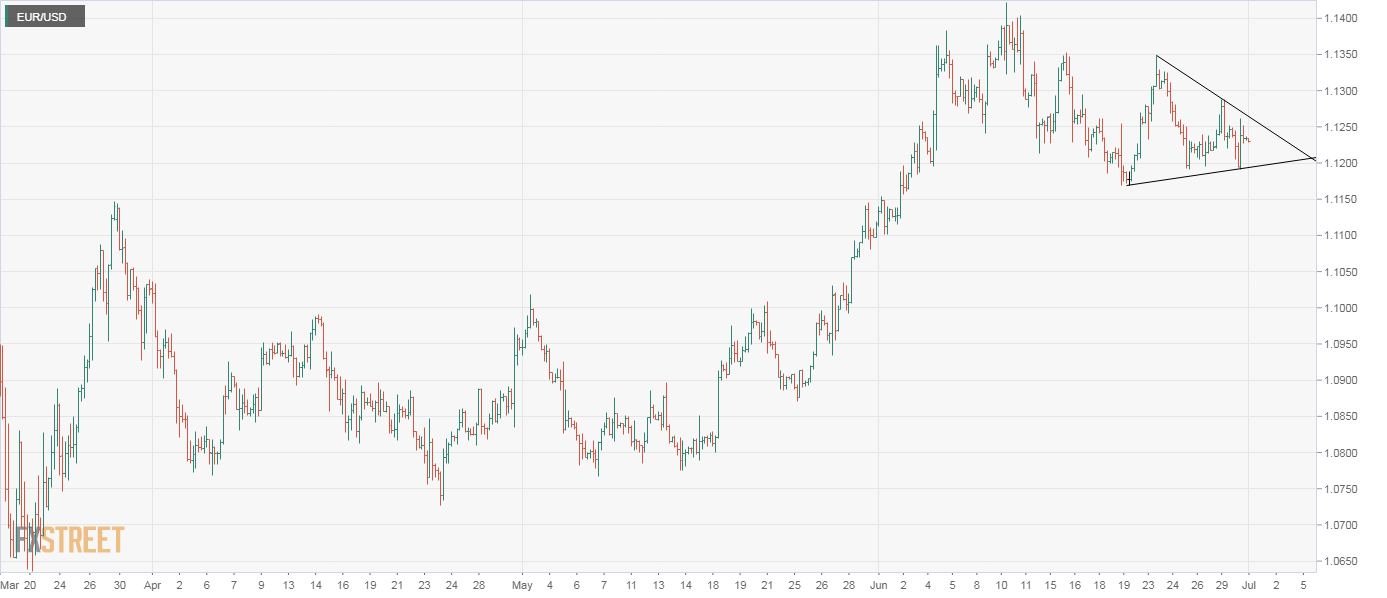
- EUR/USD prints a contracting triangle on the 4-hour chart.
- A breakout would set the tone for a re-test of recent highs.
EUR/USD has created lower highs and higher lows in the last 12 trading days, according to the 4-hour chart.
The immediate bias would remain neutral as long as the pair is held within that narrowing price range, also known as the symmetrical triangle.
A break below the lower end of the triangle, currently at 1.1209, would imply a resumption of the pullback from the recent high of 1.1422 and open the doors to 1.1148 (March 27 high).
Alternatively, a range breakout would open the doors to a re-test of resistance at 1.1349 (June 23 high), above which, the focus would shift to the recent high of 1.1422.
A triangle breakout looks likely as the 14-day relative strength index (RSI) is reporting bullish conditions with an above-50 print and the daily chart shows a golden crossover. Last week’s inverted bullish hammer also favors an upside breakout in the shared currency.
4-hour chart
Trend: Bullish
Technical levels
