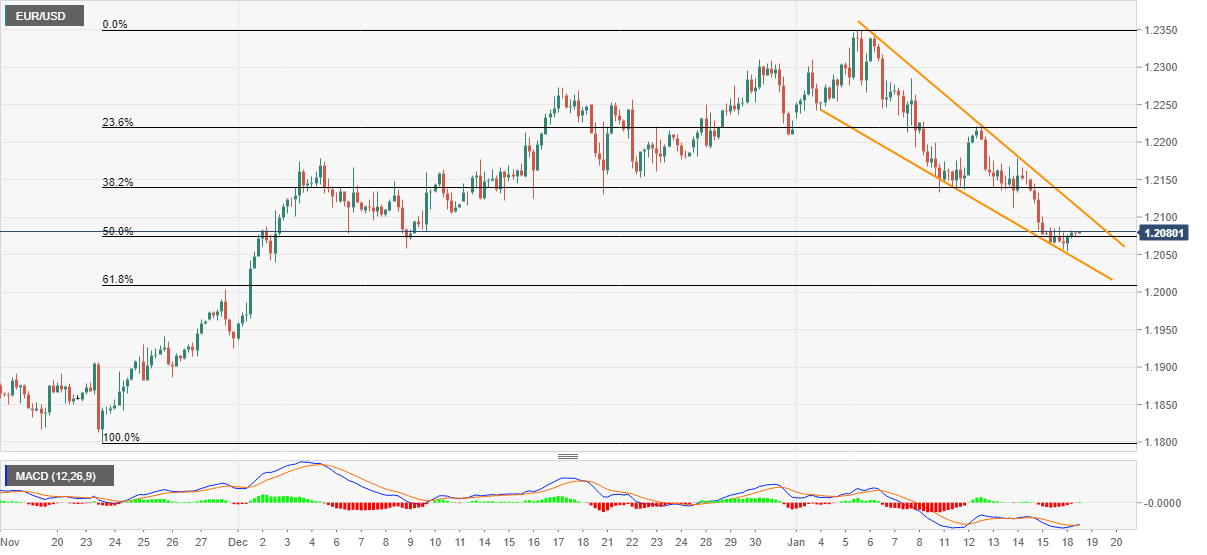
- EUR/USD wavers in a small range after bouncing off seven-week low.
- Bullish chart pattern, recovering MACD keep buyers hopeful.
- Early February lows, 61.8% Fibonacci retracement add to the downside filters.
EUR/USD portrays choppy trading moves between 1.2075 and 1.2080, currently near 1.2076, during Tuesday’s Asian session. The pair dropped to the lowest since December 02 the previous day before taking a U-turn from the support line of a two-week-old falling wedge chart pattern on the four-hour (4H) play.
Considering the recovery in prices backed by the improving MACD signals, the quote is likely to direct the corrective pullback towards the 1.2100 threshold, for now.
However, any further upside past-1.2100 needs to cross the falling wedge’s resistance line, at 1.2116 now, to recall the EUR/USD buyers eyeing to refresh the multi-month high above 1.2349.
During the upside, Wednesday’s top around 1.2210 can offer an intermediate halt while April 2018 peak surrounding 1.2415 can please the bulls afterward.
On the contrary, the quote’s U-turn from present levels will have strong support around 1.2045/40 area including the pattern’s lower line and December 02 trough.
Even if the EUR/USD prices remain weak past-1.2040, 61.8% Fibonacci retracement of November 23 to January 06 upside and November 30 top, around 1.2010-1.2000, will challenge the south-run.
EUR/USD four-hour chart
Trend: Pullback expected

