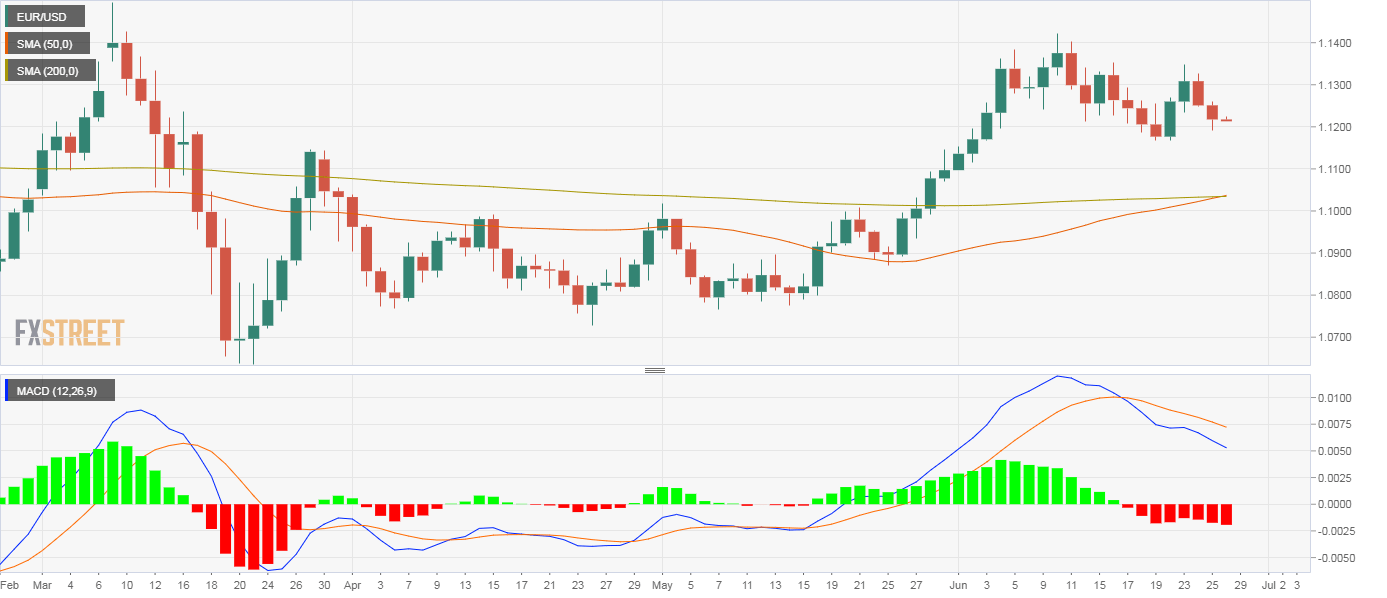
- EUR/USD’s daily chart shows a golden crossover, a long-term bull market indicator.
- The bull cross has so far failed to invite buying pressure.
- Other indicators favor deeper declines toward support at 1.1168.
EUR/USD is looking to extend its two-day losing streak despite the confirmation of a golden crossover, a bullish crossover of the 50- and 200-day simple moving averages (SMAs).
A golden cross is widely considered an indicator of the long-term bull market. So far, however, the bull cross has failed to put a bid under EUR/USD.
The pair is currently trading at 1.1215, representing marginal losses on the day, having put in a high of 1.1224 during the overnight trade. The pair fell 0.29% on Thursday, confirming a reversal lower signaled by Wednesday’s bearish inside day candlestick pattern.
The daily chart MACD histogram is producing deeper bears below the zero line, a sign of the strengthening of the downward momentum. Notably, the indicator is reporting the strongest bearish conditions in three months.
The pair risks falling to support at 1.1168 (June 19 low). A close below that will likely invite stronger selling pressure, yielding a drop to 1.1032 (200-day SMA). Alternatively, a close above 13.1349 (June 23) is needed to confirm a bullish reversal.
Daily chart
Trend: Bullish
Technical levels
