- EUR/USD looks north as 15-minute chart shows a bull flag breakout.
- Daily candles and RSI also favor stronger gains in the shared currency.
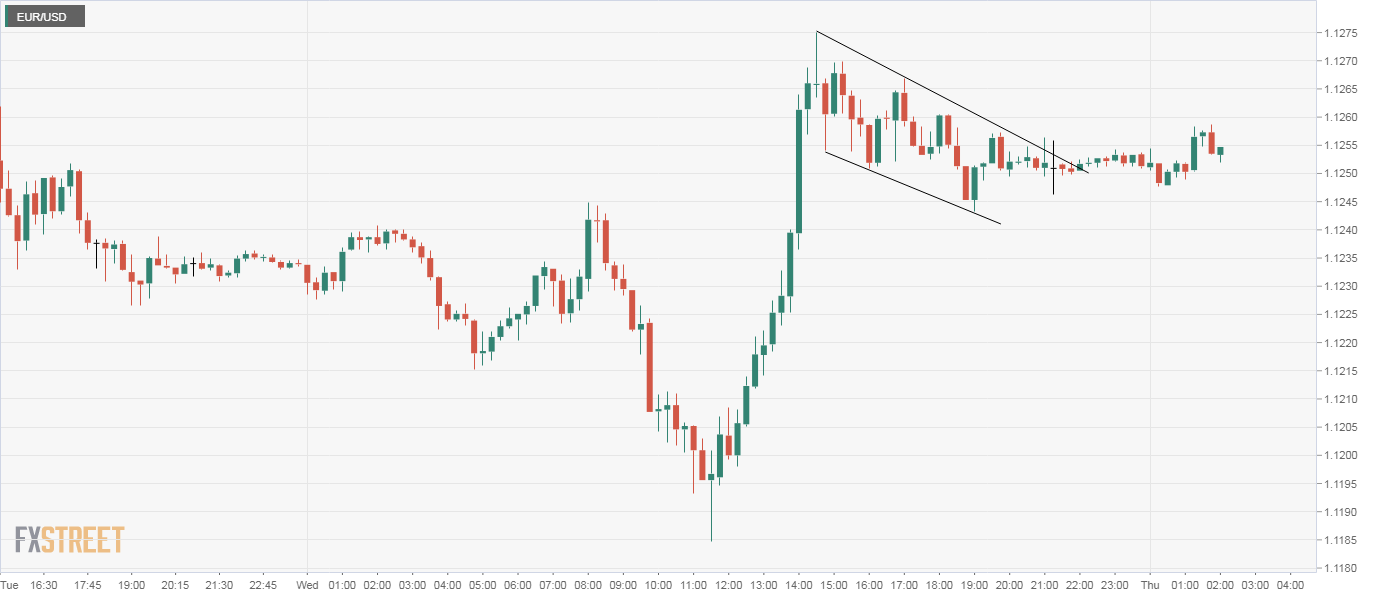
EUR/USD is trading in a sideways manner around 1.1255 at press time, having defended the psychological support of 1.12 in the previous two days.
The pair’s 15-minute chart shows a bull flag breakout, a bullish continuation pattern suggesting scope for a rally to 1.1340 (target as per the measured move method).
Supporting the bullish case are the long tails attached to the previous two daily candles, which indicate dip demand. In addition, the 14-day relative strength index is holding in the bullish territory above 50.
However, ahead of 1.1340, the pair may face resistance at 1.1290. That level is currently housing the trendline falling from June 10 and June 23 highs.
The bullish bias would be invalidated if the pair finds acceptance under 1.12, in which case, the ascending 50-day simple moving average (SMA), currently at 1.1069, may come into play.
Daily chart
Trend: Bullish
Technical levels
