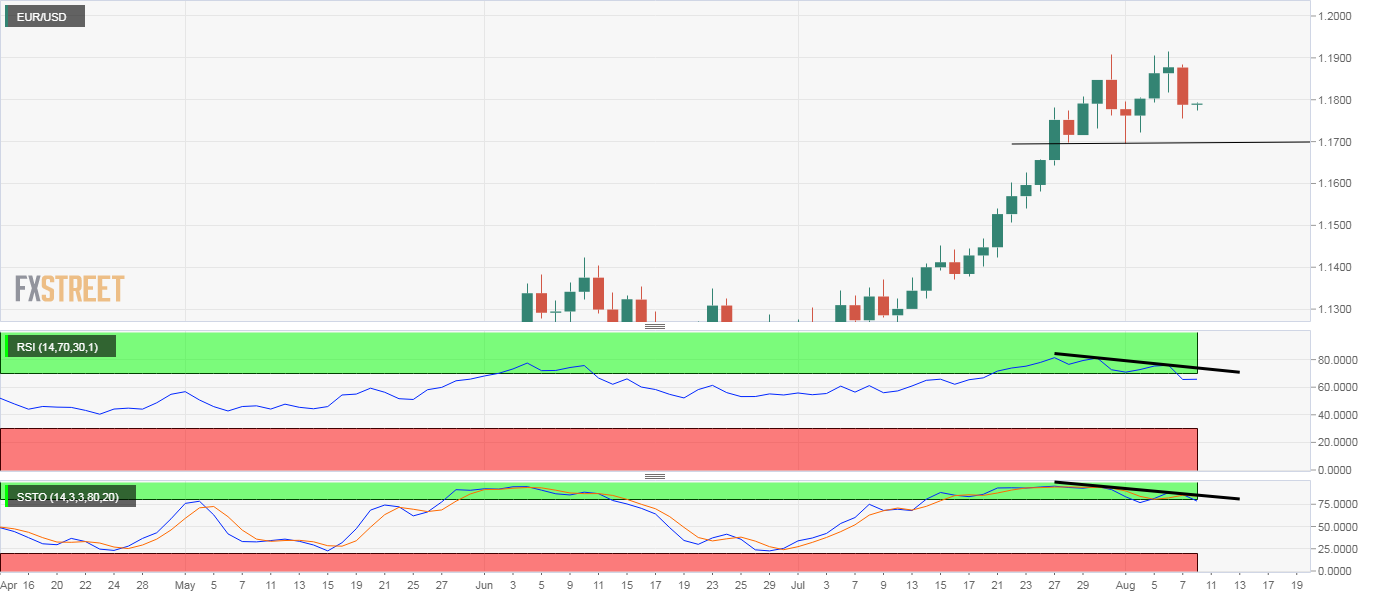
- EUR/USD’s daily chart shows a bearish divergence of key indicators.
- The candlestick arrangement on the daily chart is biased bearish.
- The pair may have carved out of an interim top above 1.19.
EUR/USD’s rally may have run out of steam and a multi-month high of 1.1916 reached on Thursday may turn out to be an interim top, technical studies indicate.
The daily chart shows a bearish divergence of the relative strength index and slow stochastic. A bearish divergence occurs when an indicator charts lower highs as opposed to higher lows, higher highs on price and is taken to be the sign of ebbing of bullish momentum.
In addition, Friday’s 0.78% decline validated the uptrend exhaustion signaled by Thursday’s spinning top candle and confirmed a short-term bullish-to-bearish trend change.
As such, a stronger pullback may be seen this week. Immediate support is located at 1.1696 (Aug. 3 low), which, if breached, would confirm a double top breakdown on the daily chart and open the doors for 1.1482 (target as per the measured move method). On the higher side, 1.1916 is the level to beat for the bulls. At press time, the pair is sidelined near 1.1791.
Daily chart
Trend: Bearish
Technical levels
