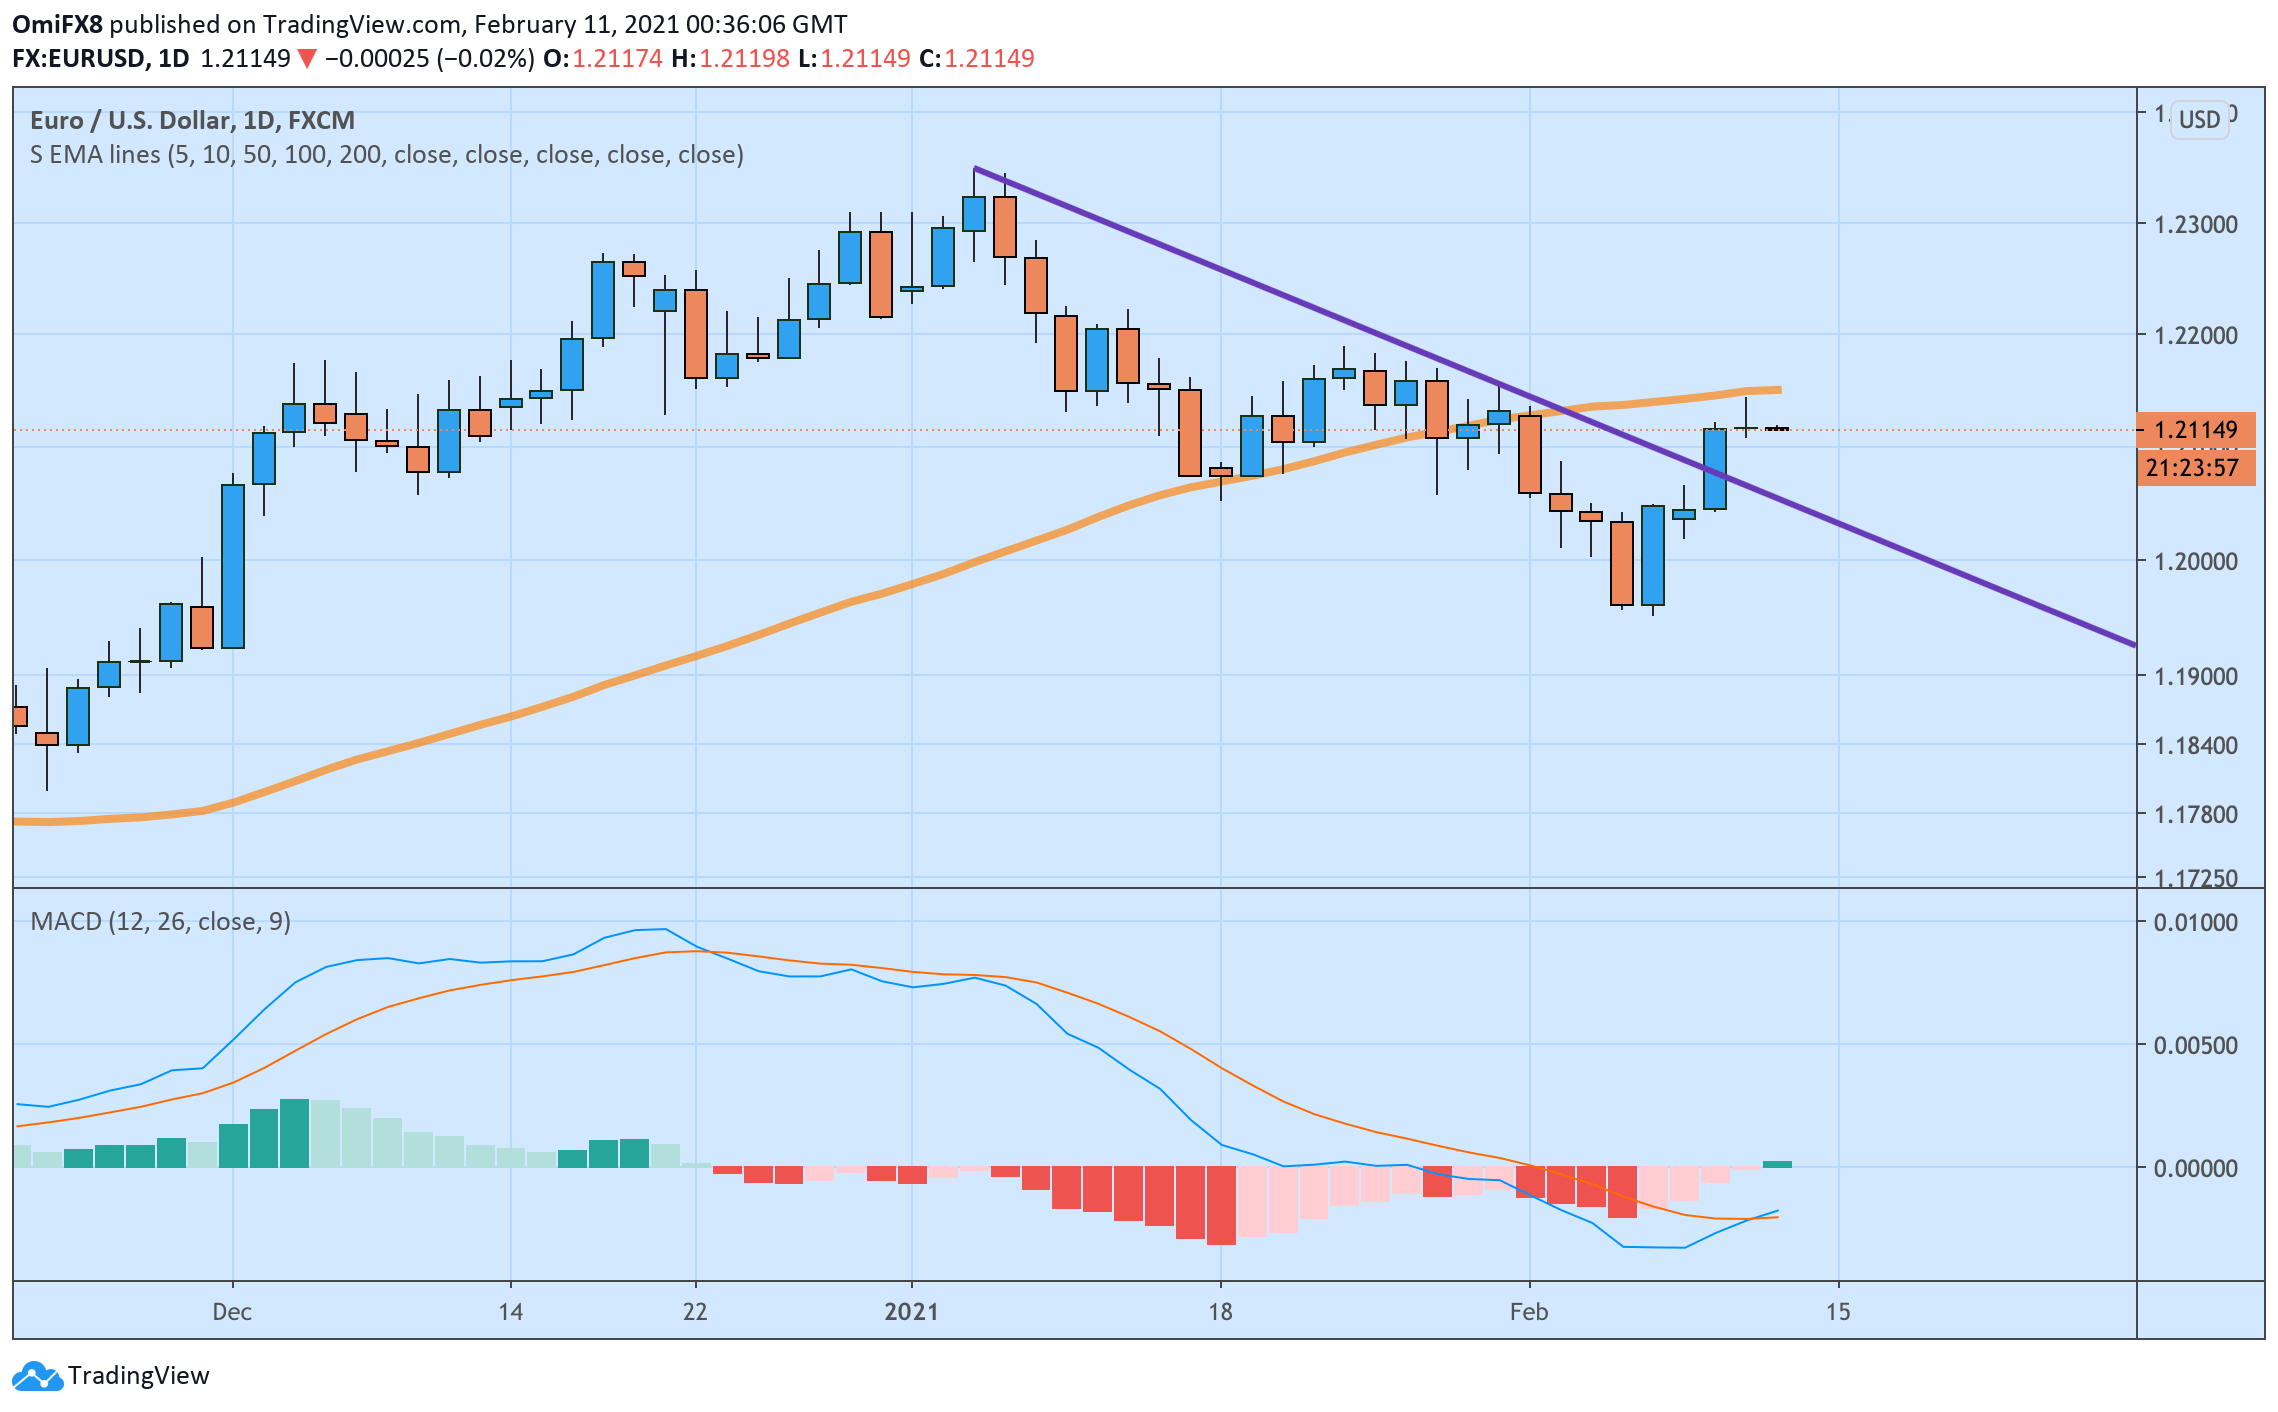
EUR/US’s daily chart MACD histogram, an indicator used to identify trend changes and trend strength, has crossed above zero for the first time since Dec. 22, signaling a bullish reversal and validating Tuesday’s upside breakout of the trendline connecting Jan. 6 and Jan. 29 highs.
The odds, therefore, appear stacked in favor of a convincing move above the 50-day Simple Moving Average (SMA) hurdle, currently at 1.2151. That said, a quick move toward the 50-day SMA is needed, as the long upper wick attached to Wednesday’s Doji candle is signaling bull fatigue and scope for a fresh drop toward 1.2050.
At press time, the pair is trading mostly unchanged on the day near 1.2115, having failed to take out the 50-day SMA resistance on Wednesday.
Daily chart
Trend: Bullish
Technical levels
