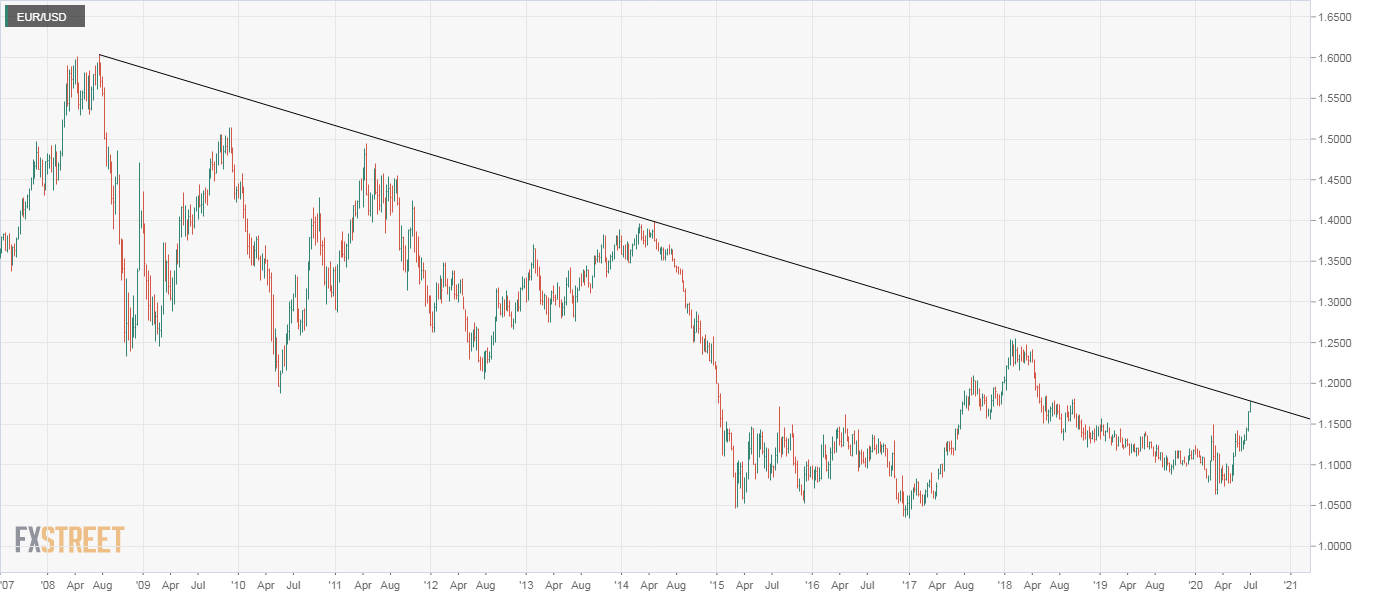
- EUR/USD probes a 12-year-long macro bearish trendline.
- A break higher may remain elusive for some time due to overbought conditions.
The American dollar’s relentless sell-off has pushed the EUR/USD close to the resistance of the trendline falling from July 2008 and May 2014 highs.
At press time, the trendline resistance is located at 1.1788. The pair clocked a high fo 1.1781 during the overnight trade and is now trading at 1.1764, representing a 0.9% gain on a week-to-date basis.
A strong move above 1.1788 would imply an end of the decade long macro bearish trend. That said, the 61.8% Fibonacci retracement of the sell-off from the February 2018 high of 1.2556 to the 2020 low of 1.0636 is located at 1.1822. A violation there would be stronger evidence of the bullish breakout.
However, with the 14-day relative strength index reporting extreme overbought conditions, the bulls may have a tough time forcing a convincing break above 1.1822 in the short-run.
The pair looks vulnerable to a sudden pullback to the ascending 5-day simple moving average (SMA), currently at 1.1667.
Weekly chart
Trend: Bullish but overbought
Technical levels
