- EUR/USD’s daily chart shows a bearish RSI divergence.
- Wednesday’s high of 1.1422 may turn out to be a temporary top.
EUR/USD rallied to a two-month high of 1.1422 on Wednesday, having put in a bullish higher low of 1.1214 on Tuesday.
However, the new multi-month high has not been confirmed by the 14-day relative strength index (RSI). The hourly chart RSI, too, is reporting a bearish divergence. Both patterns indicate the uptrend could be running out of steam and the high of 1.1422 reached on Wednesday may hold the upside.
Meanwhile, on the downside, 1.1214 is the key support, which, if breached, would invalidate the higher lows setup on the daily chart and open the doors to 1.1021 (200-day simple moving average)
Dips, however, could be short-lived, as the weekly chart RSI is now reporting the strongest bullish bias in February 2018. At press time, the pair is trading at 1.1378, representing marginal gains on the day.
Daily chart
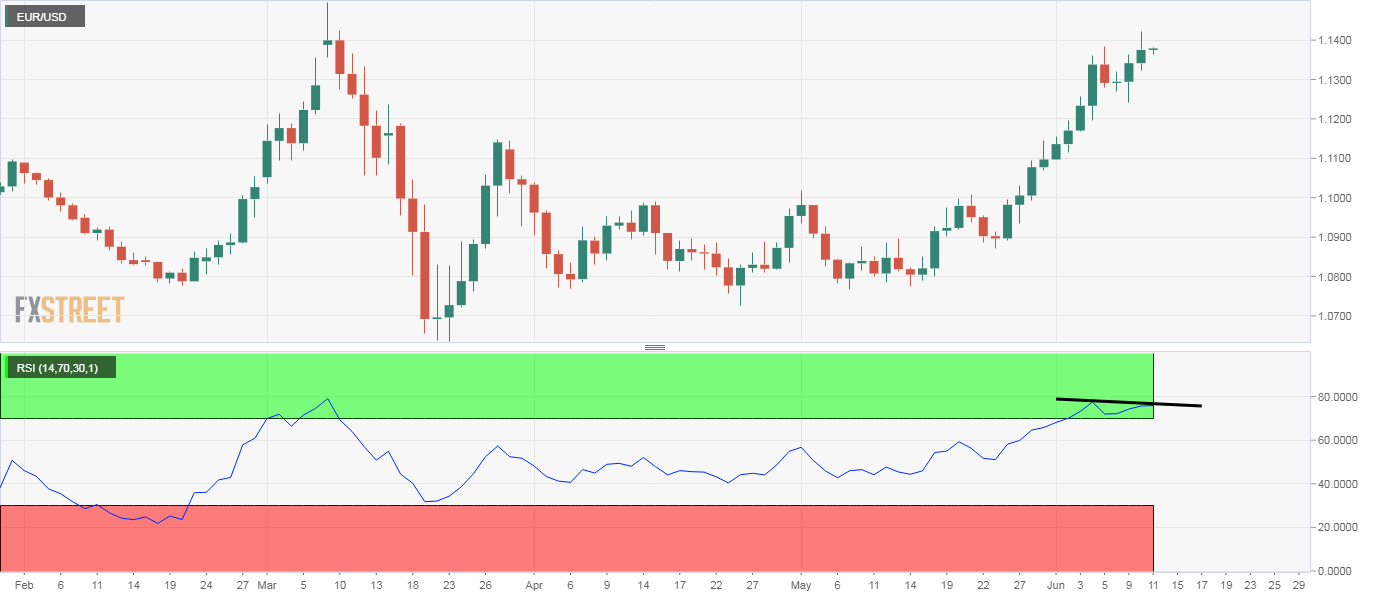
Trend: Bull exhaustion
Technical levels
