- EUR/USD stays mildly positive above 200-bar SMA.
- Sustained trading beyond the key SMA favor buyers to confirm the bullish chart pattern.
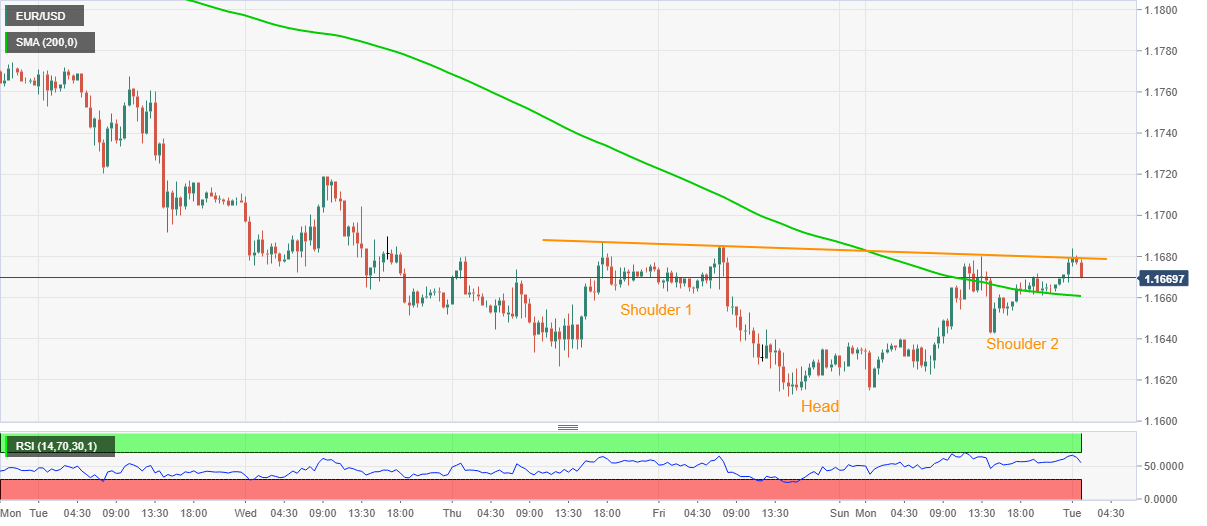
- Fresh selling may wait for a clear downside break below 1.1600.
EUR/USD eases to 1.1675, up 0.10% on a day, during Tuesday’s Asian session. In doing so, the major currency pair steps back from the neckline of a short-term head-and-shoulders bullish chart pattern. However, successful trading beyond 200-bar SMA, amid an absence of overbought RSI, keeps the buyers hopeful.
Hence, fresh buying will take place on a clear break above 1.1680, which in turn will target 1.1750 theoretical aim with the September 23 top, near 1.1720, likely acting as an intermediate halt.
In a case where EUR/USD prices remain strong past-1.1750, the 1.1800 threshold and September 21 top surrounding 1.1870/75 will be in the spotlight.
Alternatively, the pair’s downside below the 200-bar SMA level of 1.1660 may recall 1.1640 and 1.1610 immediate supports on the chart.
Though, EUR/USD bears’ dominance past-1.1610 will need validation from 1.1600 to attack March 2020 top close to 1.1500.
EUR/USD 30-minute chart
Trend: Bullish
