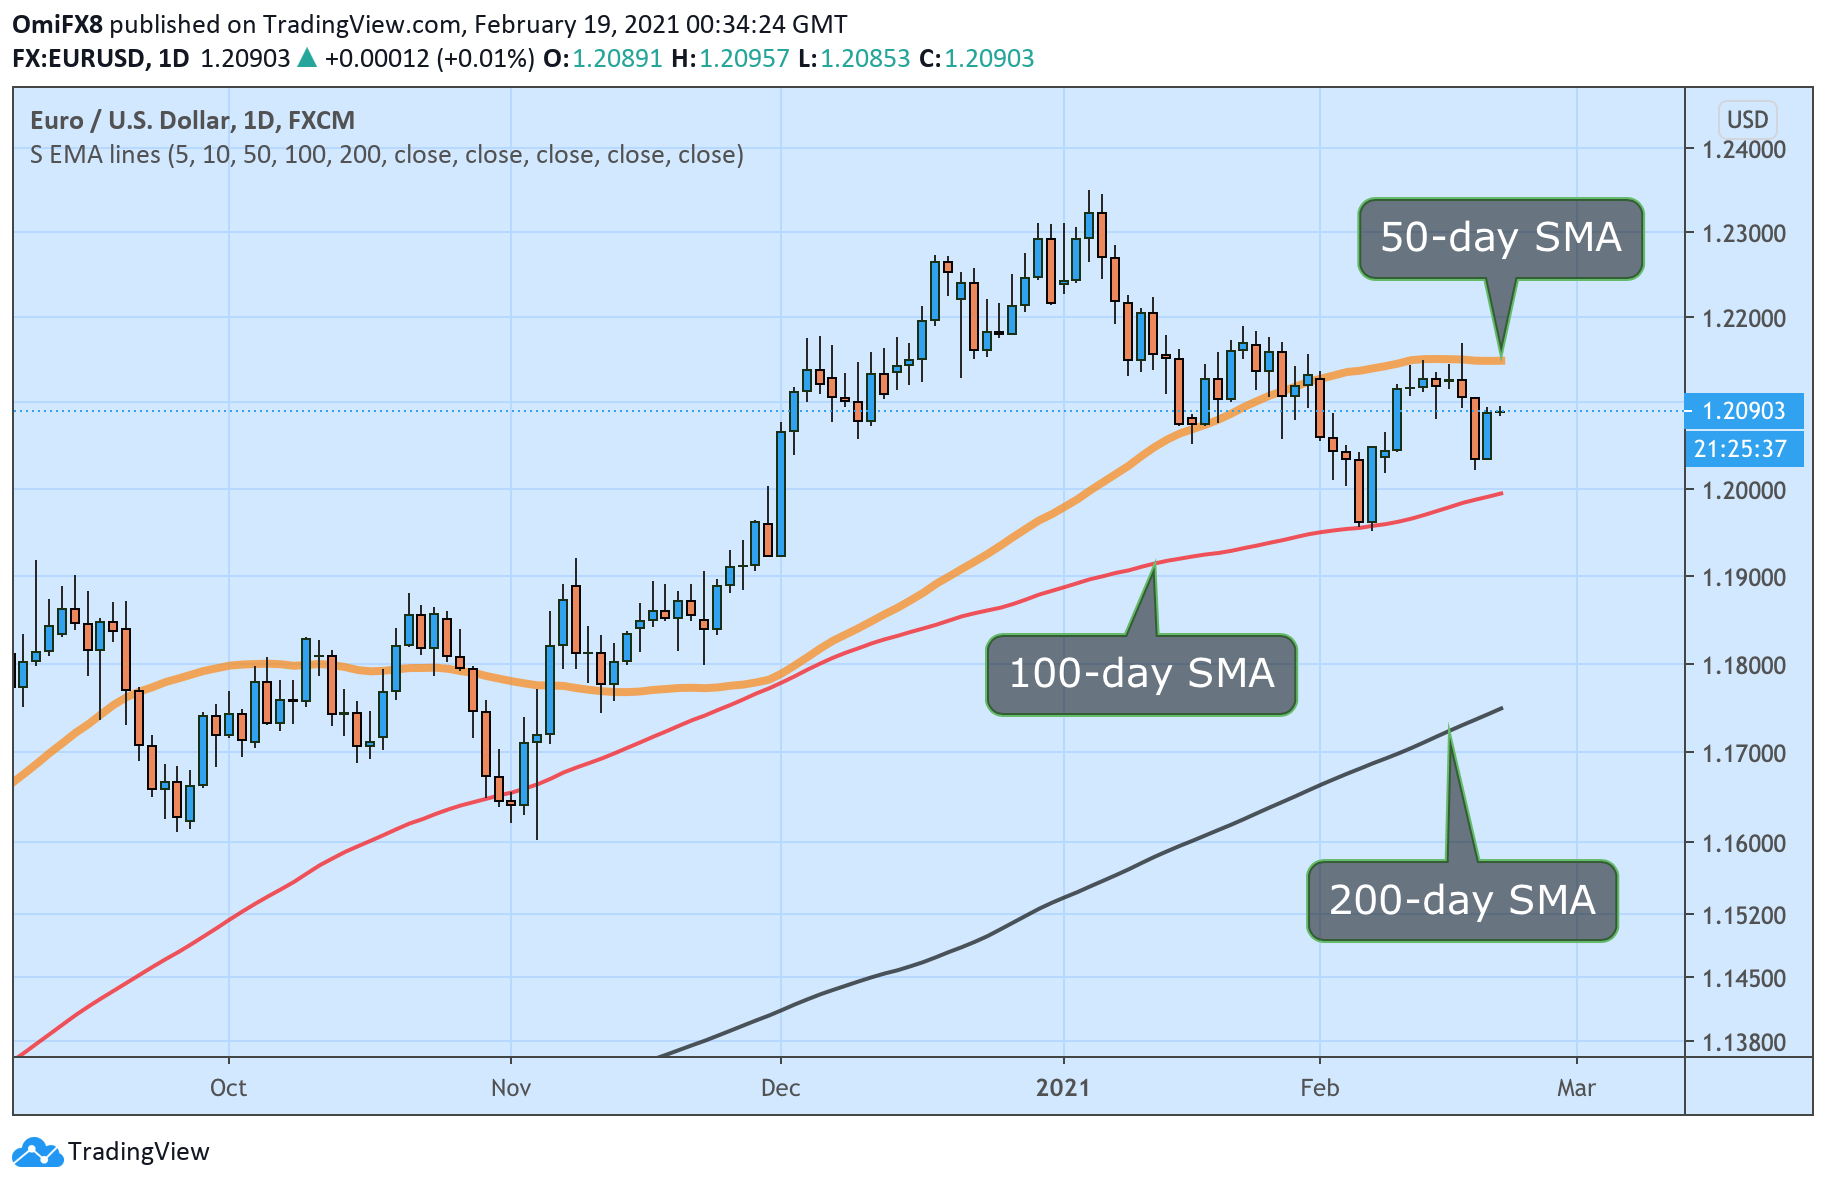
- EUR/USD ‘s daily chart shows range plat between 50- and 100-day SMAs.
- A range breakdown would shift risk in favor of a drop to 200-day SMA.
EUR/USD is currently trading unchanged on the day near 1.2090.
The daily chart shows the pair is locked in a range defined by the 50- and 100-day Simple Moving Averages (SMA) for the 11th straight trading day.
The 50-day SMA is now located at 1.2150, and the 100-day SMA is seen at 1.1996. A daily close above the former would put the bulls back into the driver’s seat, opening doors for at least 150 pip move higher.
Alternatively, a close under the 100-day SMA would imply a continuation of the pullback from the Jan. 6 high of 1.2349 and expose the 200-day SMA, currently at 1.1751.
According to Thursday’s bullish inside day candle, the pair is likely to test the 50-day SMA hurdle.
Daily chart
Trend: Neutral
Technical levels
