EUR/USD has kicked off the week below 1.1000, consolidating the losses it suffered late on Friday. Trade wars, Brexit, and German elections are in the limelight. How is the currency pair positioned?
The Technical Confluences Indicator is showing that EUR/USD faces some resistance at 1.1006, which is the convergence of the Fibonacci 38.2% one-day, the Bollinger Band 1h-Middle, the BB 1d-Lower, and the Fibonacci 23.6% one-week.
Looking up, a considerable cap awaits at 1.1070, which is a dense cluster including the Simple Moving Average 100-1h, the Fibonacci 38.2% one-month, the previous daily high, the SMA 5-1d, and more.
Looking down, some support awaits at 1.1083, which is the meeting point of the previous 4h-low, the Fibonacci 23.6% one-day, and the BB 15min-Lower.
More significant support awaits only at 1.0886, where the Pivot Point one-month Support 1 hits the price.
Here is how it looks on the tool:
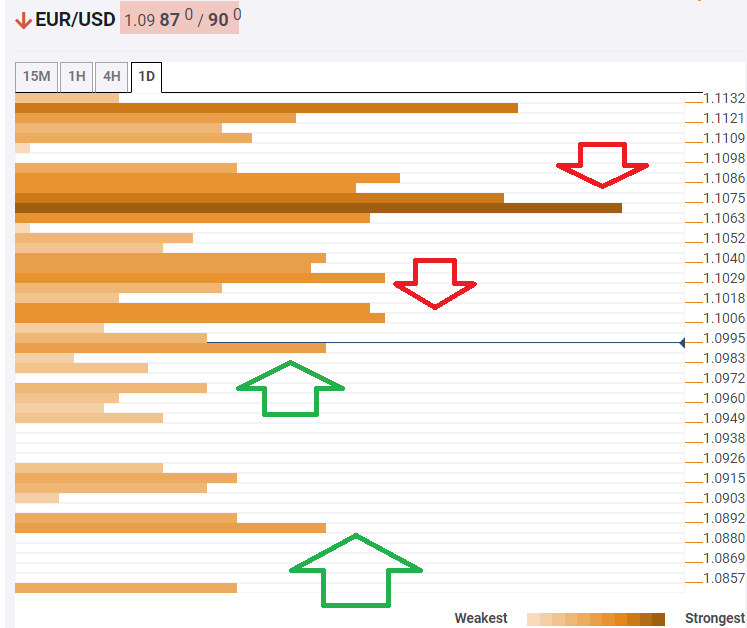
Confluence Detector
The Confluence Detector finds exciting opportunities using Technical Confluences. The TC is a tool to locate and point out those price levels where there is a congestion of indicators, moving averages, Fibonacci levels, Pivot Points, etc. Knowing where these congestion points are located is very useful for the trader, and can be used as a basis for different strategies.
This tool assigns a certain amount of “weight” to each indicator, and this “weight” can influence adjacents price levels. These weightings mean that one price level without any indicator or moving average but under the influence of two “strongly weighted” levels accumulate more resistance than their neighbors. In these cases, the tool signals resistance in apparently empty areas.
Learn more about Technical Confluence
