- EUR/USD is leaning lower amid rising Mid-East tensions.
- Weak German figures and upbeat US ones may weigh on the pair.
- Wednesday’s chart is pointing to a bearish breakout of the wedge.
“All is well” – the tweet by President Donald Trump has been able to calm markets after Iran fired missiles at two American bases in Iraq. The initial risk-off reaction has been followed by a return to normality. EUR/USD has pared its initial losses.
Tehran has claimed that 80 lives were lost but also added that it is not interested in outright war. The Pentagon has yet to report about any casualties in Iran’s response to Friday’s killing of Qassem Suleimani, a top Iranian general.
It seems that both sides are disinterested in further escalation – President Donald Trump faces the Presidential elections and Iran’s economy is in a perilous state. However, any miscalculation may trigger a quick deterioration.
In an apparently unrelated incident, a Ukranian civil plane crashed after taking off from Tehran’s airport, and the lives of 180 passengers are feared. Despite reports of a technical failure, the news adds to tensions.
Outside the Middle East
While euro/dollar has taken Iran’s strike with a stride, it has other reasons to fall. Germany reported a drop of 1.3% in Factory Orders in November, far worse than expected. The manufacturing slump may drag the whole economy down.
In the US, the ISM Non-Manufacturing PMI for December beat expectations with 55 points, reflecting robust consumption. Later in the day, the ADP private-sector jobs report is forecast to show an increase of 160,000 positions in December, a jump from 67,000 in November. The publication serves as a hint toward the Non-Farm Payrolls.
See US ADP Preview: Labor market expansion is steady
EUR/USD Technical Analysis
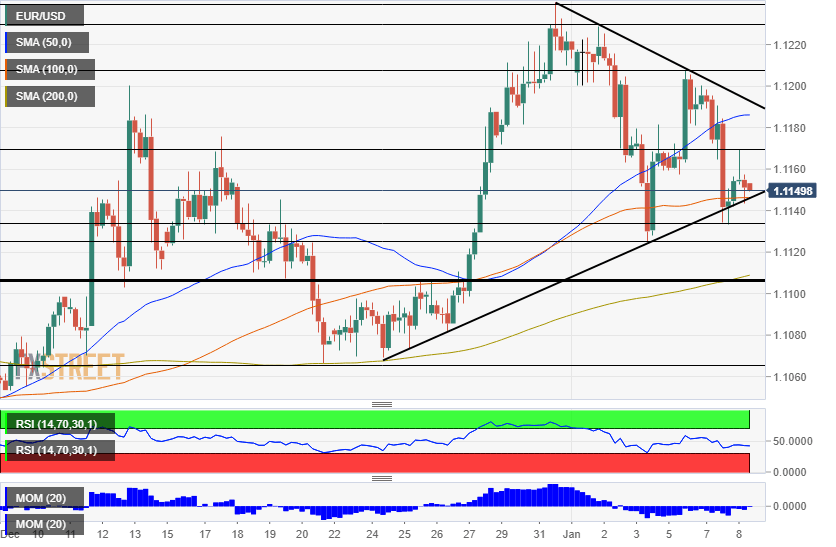
Euro/dollar is trading in a narrowing wedge, or triangle, and has already tested the downside. If it breaks below uptrend support, it may accelerate its losses.
The currency pair is trading below the 50 Simple Moving Average on the four-hour chart ad battling the 100 SMA. Downside momentum persists but is minimal.
Overall, the bears are in the lead.
Support awaits at 1.1135, which was Tuesday’s low point. It is closely followed by 1.1125, 2020 trough, and then by 1.1105, which worked in both directions in late December. 1.1065 is the next level to watch.
Resistance awaits at 1.1170, the recent swing high, and then by 1.1210, which capped it earlier this week. The late December highs of 1.1230 and 1.1240 are next.
