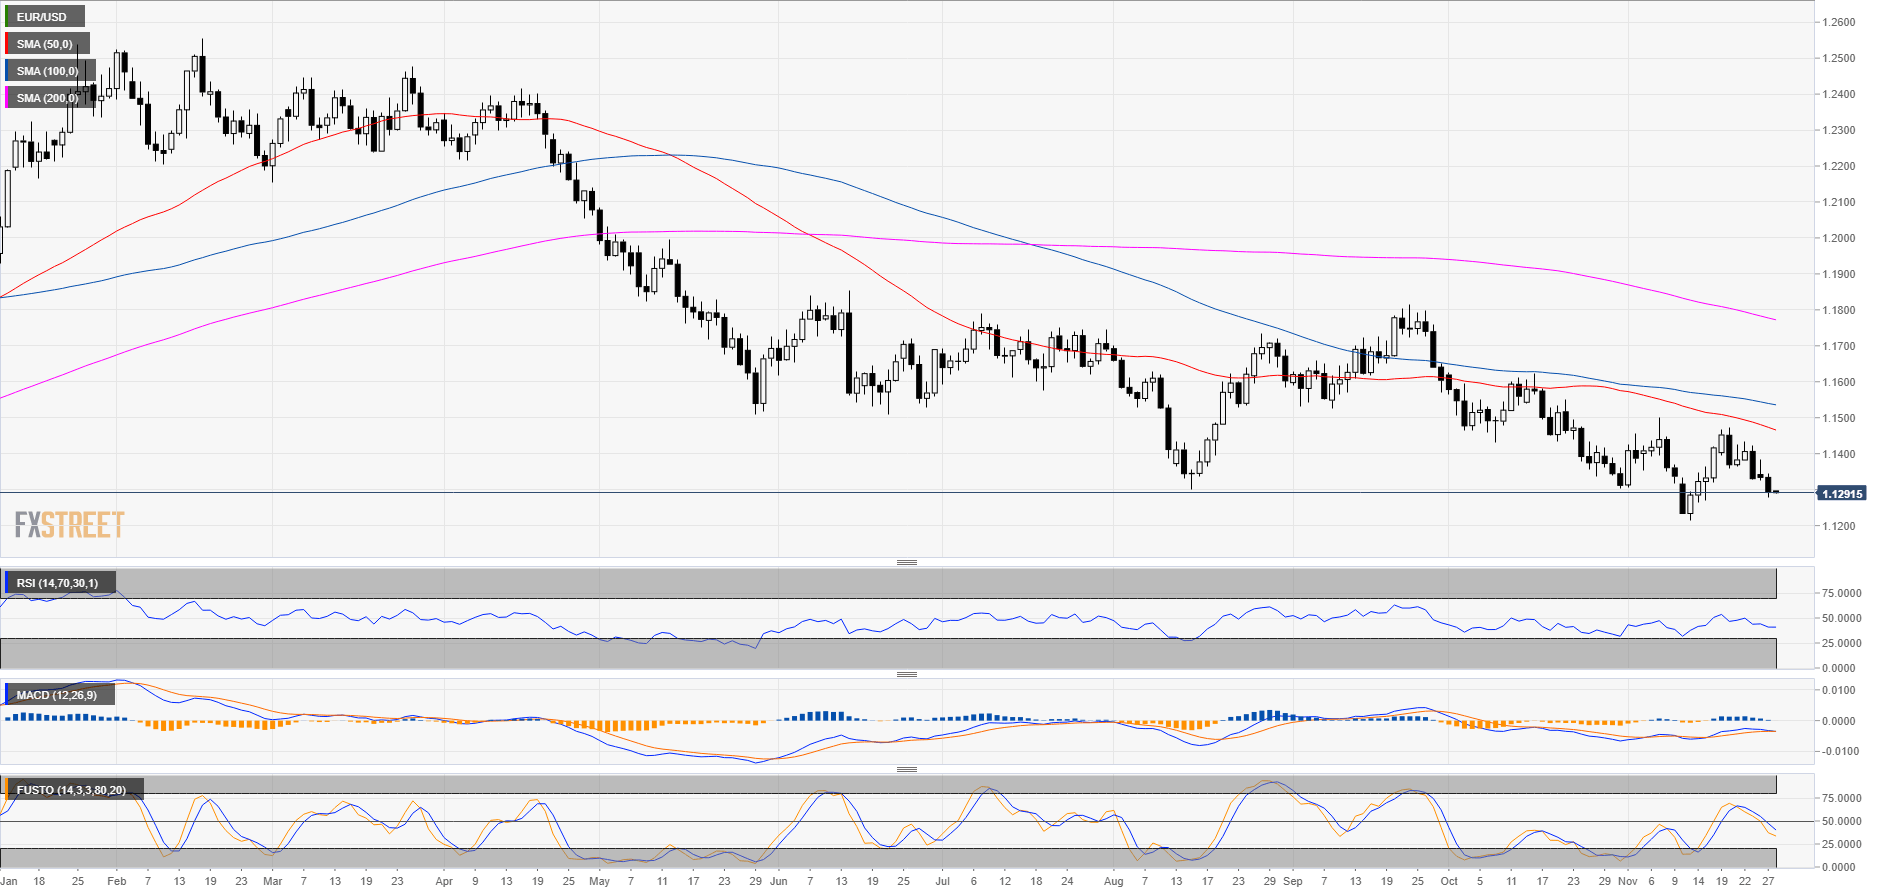
EUR/USD daily chart
- EUR/USD is trading in a bear trend below the 200-day simple moving average (SMA).
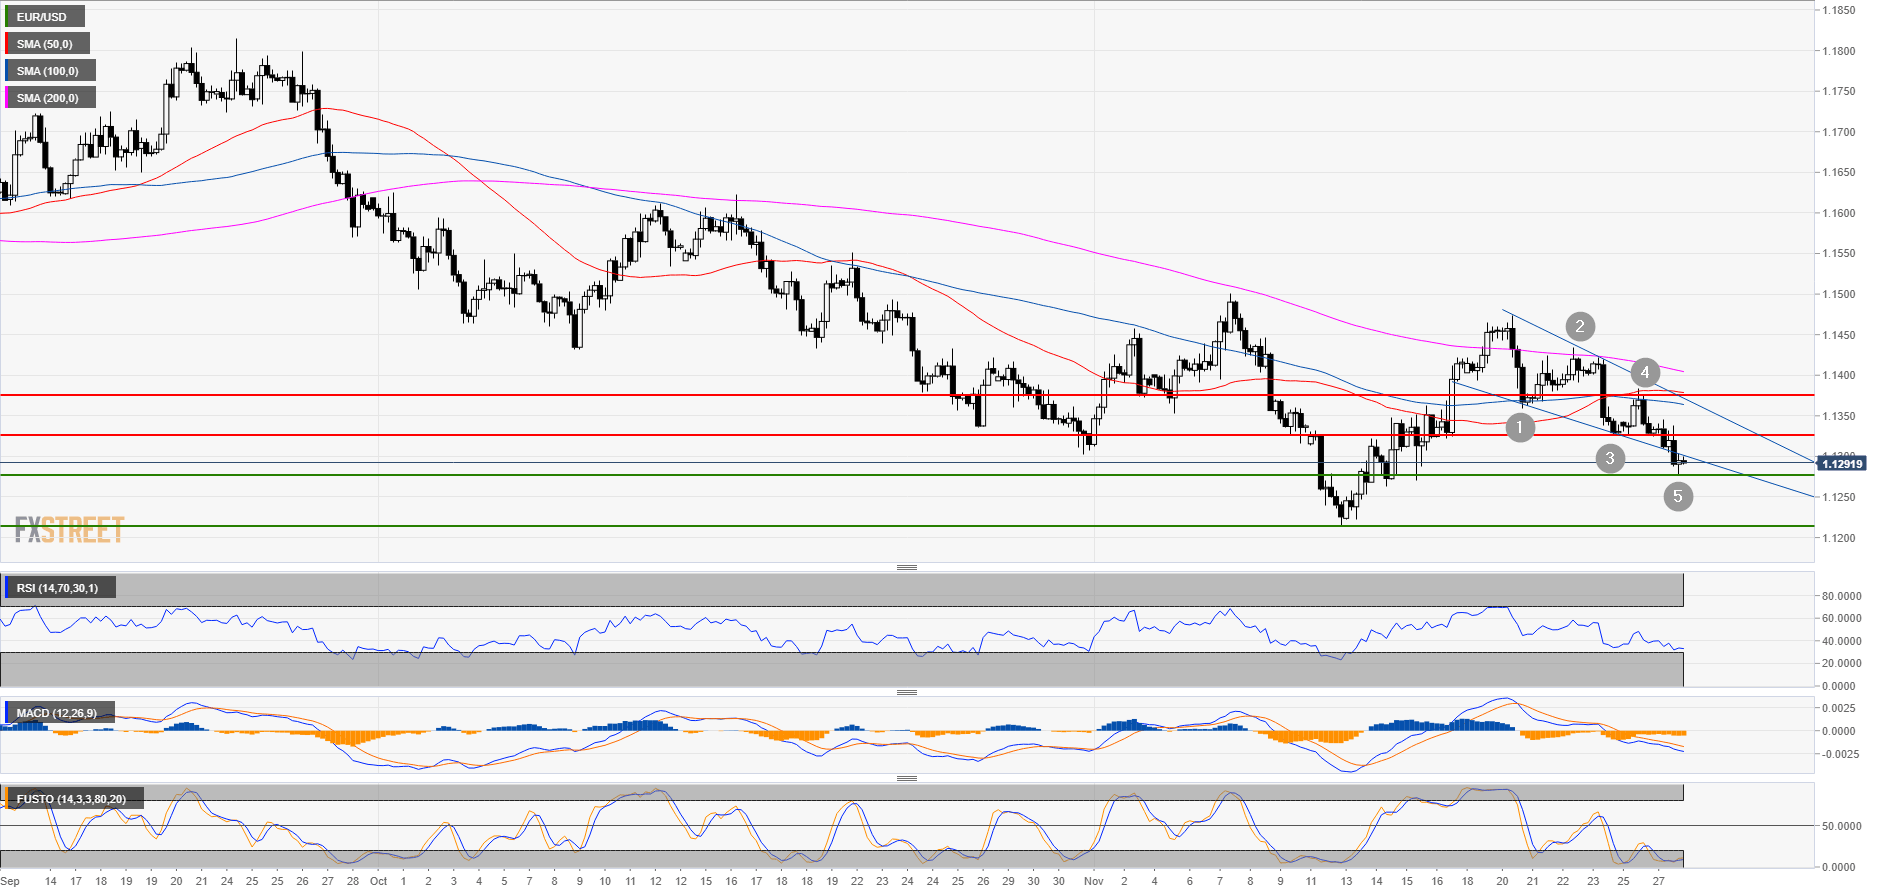
EUR/USD 4-hour chart
- EUR/USD formed a 5-wave pattern suggesting that the move down might be about to reverse.
- EUR/USD also created a double bottom bull flag with November 15 low.
- The RSI is below the 50 line, MACD is bearish although the histogram is showing bullish divergence, the Stochastic indicator is deeply oversold.
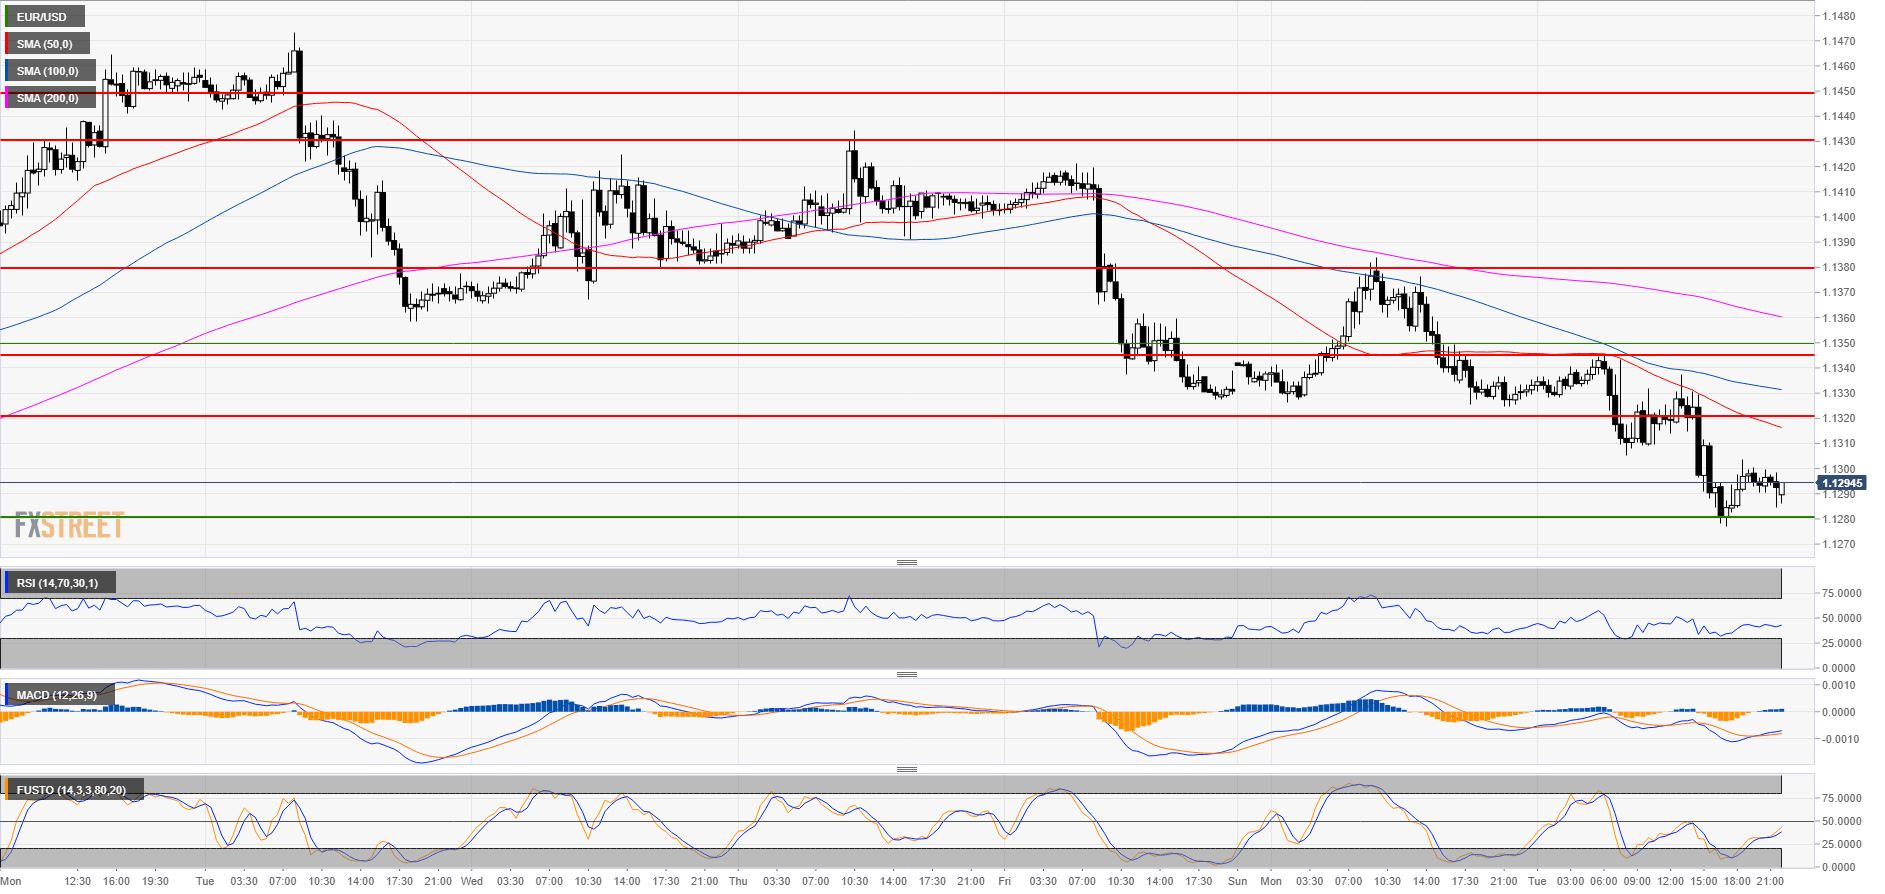
EUR/USD 30-minute chart
- If bulls manage to hold the market near 1.1300 then 1.1320 and 1.1380 can be back on the cards.
- Alternatively, failure to hold 1.1300 can lead to a quick dive to the 2018 low.
Additional key levels
EUR/USD
Overview:
Today Last Price: 1.1292
Today Daily change: -42 pips
Today Daily change %: -0.371%
Today Daily Open: 1.1334
Trends:
Previous Daily SMA20: 1.1364
Previous Daily SMA50: 1.1481
Previous Daily SMA100: 1.1544
Previous Daily SMA200: 1.1785
Levels:
Previous Daily High: 1.1384
Previous Daily Low: 1.1326
Previous Weekly High: 1.1473
Previous Weekly Low: 1.1328
Previous Monthly High: 1.1625
Previous Monthly Low: 1.1302
Previous Daily Fibonacci 38.2%: 1.1348
Previous Daily Fibonacci 61.8%: 1.1362
Previous Daily Pivot Point S1: 1.1312
Previous Daily Pivot Point S2: 1.1289
Previous Daily Pivot Point S3: 1.1253
Previous Daily Pivot Point R1: 1.137
Previous Daily Pivot Point R2: 1.1406
Previous Daily Pivot Point R3: 1.1429
