- EUR/USD broke above the 1.1672 resistance level and has gained about 30 pips in the early European session. The 50-period simple moving average (SMA) broke above the 200 SMA, while the 100 SMA is about to do so, suggesting building bullish momentum.
- The 1.1700 figure is likely going to be the decisive level to break if bulls want to extend the bull leg towards 1.1730-1.1750 area. Supports to the downside are likely located near 1.1640-1.1649 area and 1.1600-1.1613 zone. Bulls currently have an advantage while above 1.1600-1.1613 area.
- Investors are going to focus on the preliminary reading of the German Harmonized Index of Consumer Prices at 12:00 GMT which is likely going to lead to volatility.
EUR/USD 15-minute chart
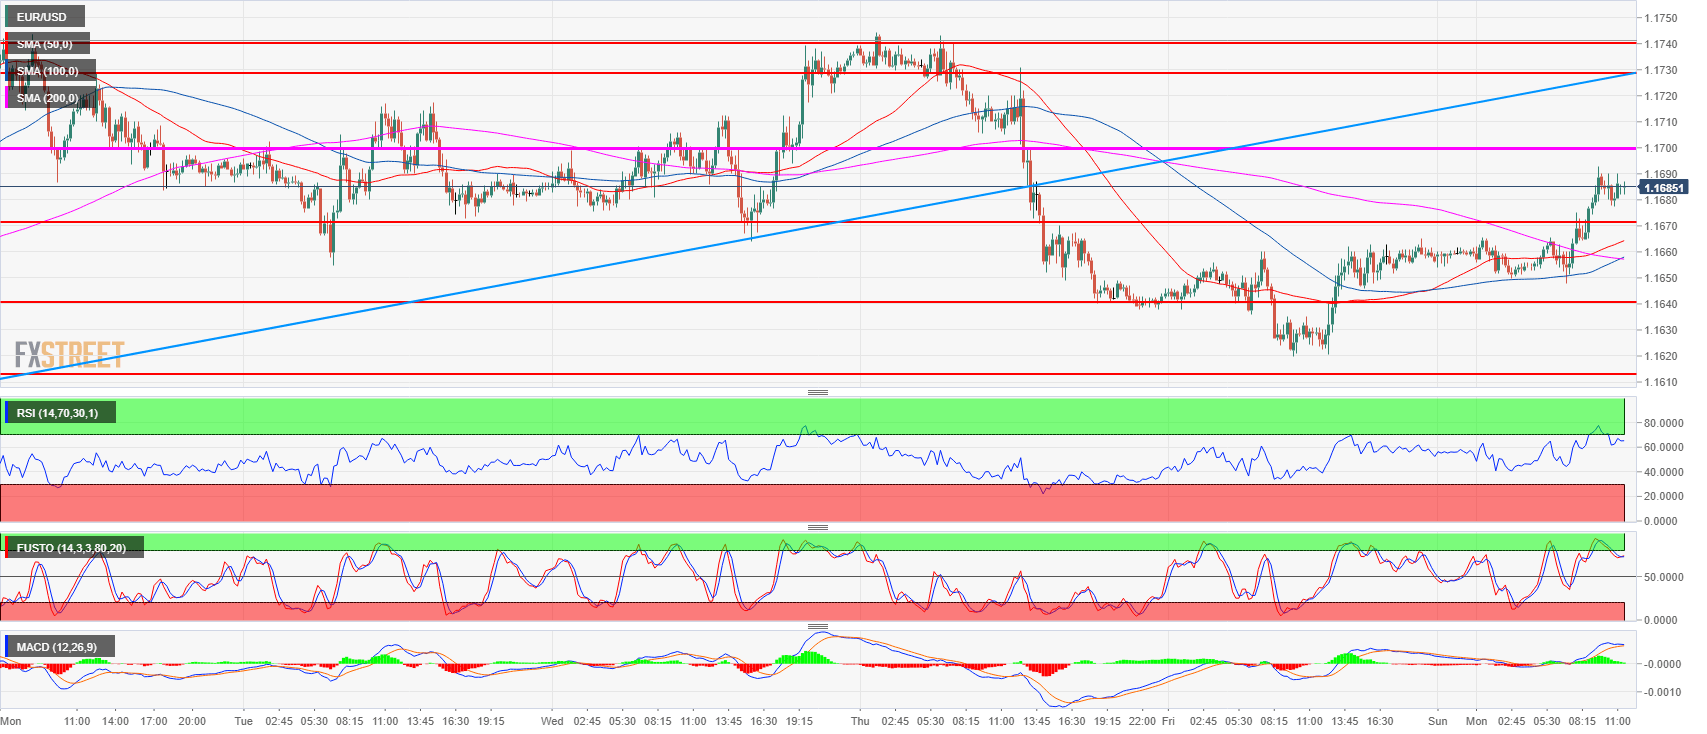
Spot rate: 1.1686
Relative change: 0.25%
High: 1.1693
Low: 1.1648
Trend: Bearish / Bullish pullback / Risk of trend reversal above 1.1730-1.1750
Resistance 1: 1.1700 figure
Resistance 2: 1.1730-1.1740-1.1750 area, 23.6% Fibonacci retracement mid-April-May bear move, weekly high.
Resistance 3: 1.1760-1.1795 supply levels
Resistance 4: 1.1851-1.1854 area, June high and 38.2% Fibonacci retracement from mid-April-May bear move
Support 1: 1.1672 June 27 high
Support 2: 1.1649 July 12 low
Support 3: 1.1640-1.1649 key level and July 12 low
Support 4: 1.1600-1.1613 figure and July 13 low
Support 5: 1.1560 June 14 low
Support 6: 1.1508 current 2018 low
