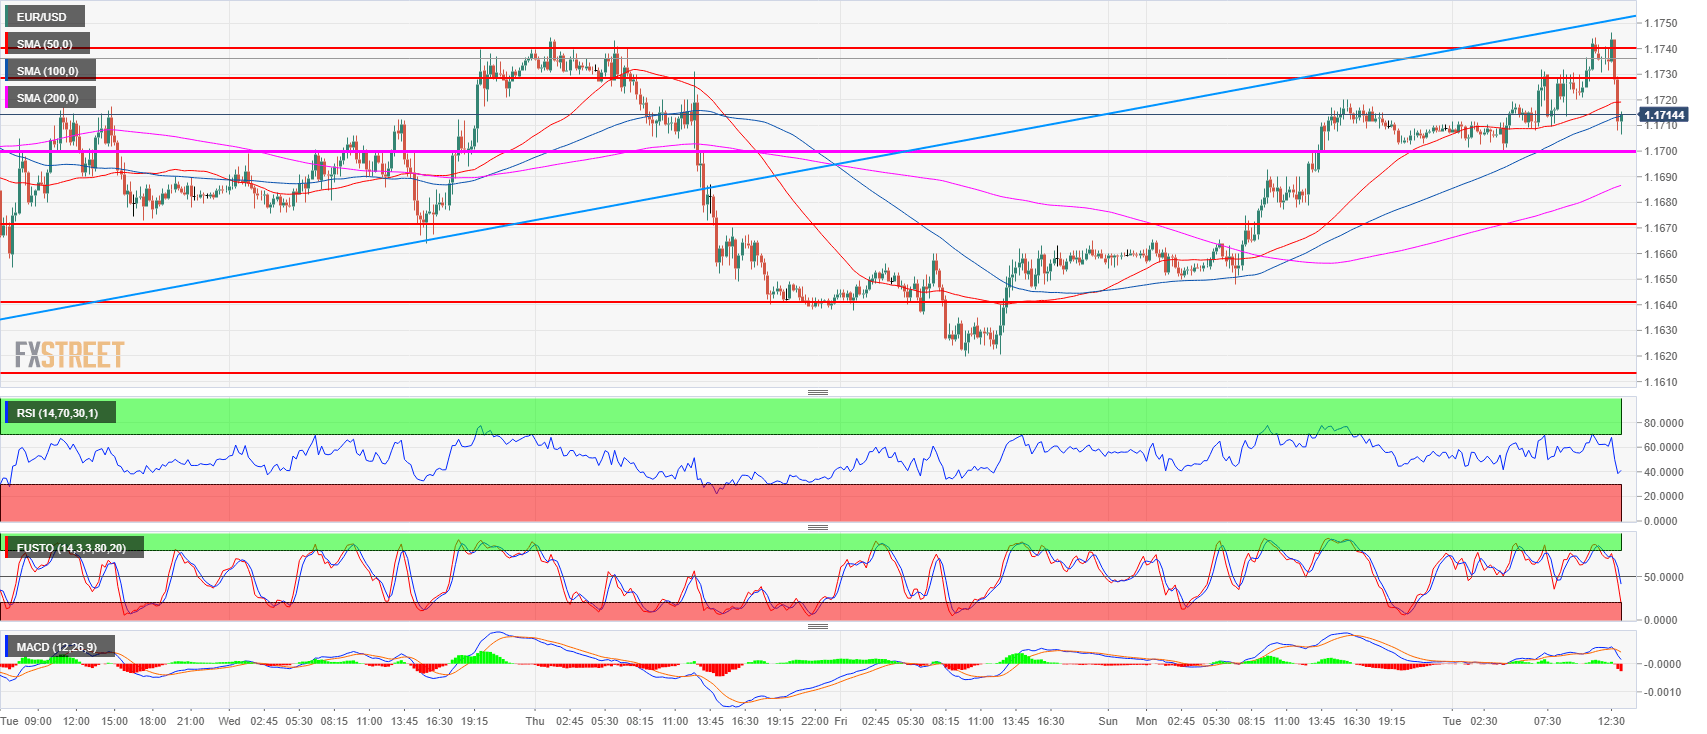
- EUR/USD is currently having a 40-pip pullback from the daily highs after EUR/USD found resistance near the 1.1750 level.
- EUR/USD has not been trading above 1.1750 since July 11 and bulls will need to gather enough strength in order to breakout above the level. EUR/USD is testing the 100-period simple moving average however more consolidation might be on the cards.
- The bullish mometum has been temporarily halted and the next level of support to the downside can be located near the 1.1700 figure and 1.1672 level.
EUR/USD 15-minute chart
Spot rate: 1.1746
Relative change: 0.06%
High: 1.1720
Low: 1.1700
Trend: Bearish
Resistance 1: 1.1730-1.1740-1.1750 area, 23.6% Fibonacci retracement mid-April-May bear move, figure.
Resistance 2: 1.1760-1.1795 supply levels
Resistance 3: 1.1851-1.1854 area, June high and 38.2% Fibonacci retracement from mid-April-May bear move
Support 1: 1.1700 figure
Support 2: 1.1672 June 27 high
Support 3: 1.1649 July 12 low
Support 4: 1.1640-1.1649 key level and July 12 low
Support 5: 1.1600-1.1613 figure and July 13 low
Support 6: 1.1560 June 14 low
Support 7: 1.1508 current 2018 low
