- EUR/USD made two attempts to break above the 1.1730-1.1740 area on Monday but was not able to breakout above the levels so far.
- EUR/USD has broken the current bullish trendline and is en route to test the 50-period simple moving average and the 1.1700 figure.
- A breakout below 1.1700 can lead to an extension of the pullback towards 1.1672 June 27 high.
EUR/USD 15-minute chart
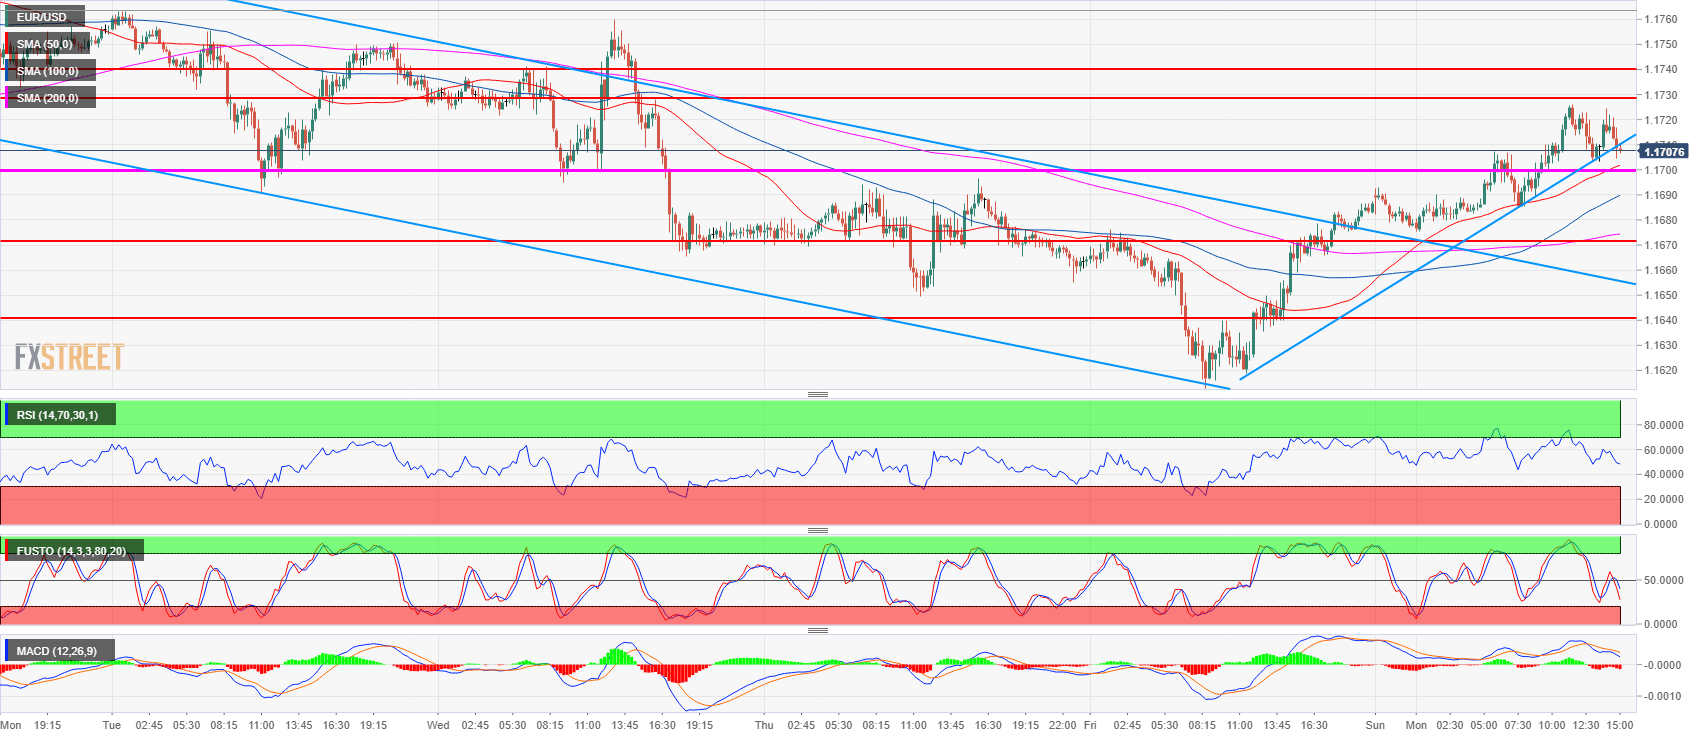
Spot rate: 1.1708
Relative change: 0.19%
High: 1.1726
Low: 1.1675
Trend: Neutral
Resistance 1: 1.1730-1.1740 area, 23.6% Fibonacci retracement from mid-April-May bear move and last week’s open.
Resistance 2: 1.1790 last week’s high
Resistance 3: 1.1851-1.1854 area, June high and 38.2% Fibonacci retracement from mid-April-May bear move
Support 1: 1.1700 figure
Support 2: 1.1672 June 27 high
Support 3: 1.1640-1.1649 area, key level and July 12 low
Support 4: 1.1613 current weekly low
Support 5: 1.1600 figure
Support 6: 1.1560 June 14 low
Support 7: 1.1508 current 2018 low
