- EUR/USD is clinging to multi-week highs in the New York session.
- The level to beat for bulls is the 1.1140 resistance.
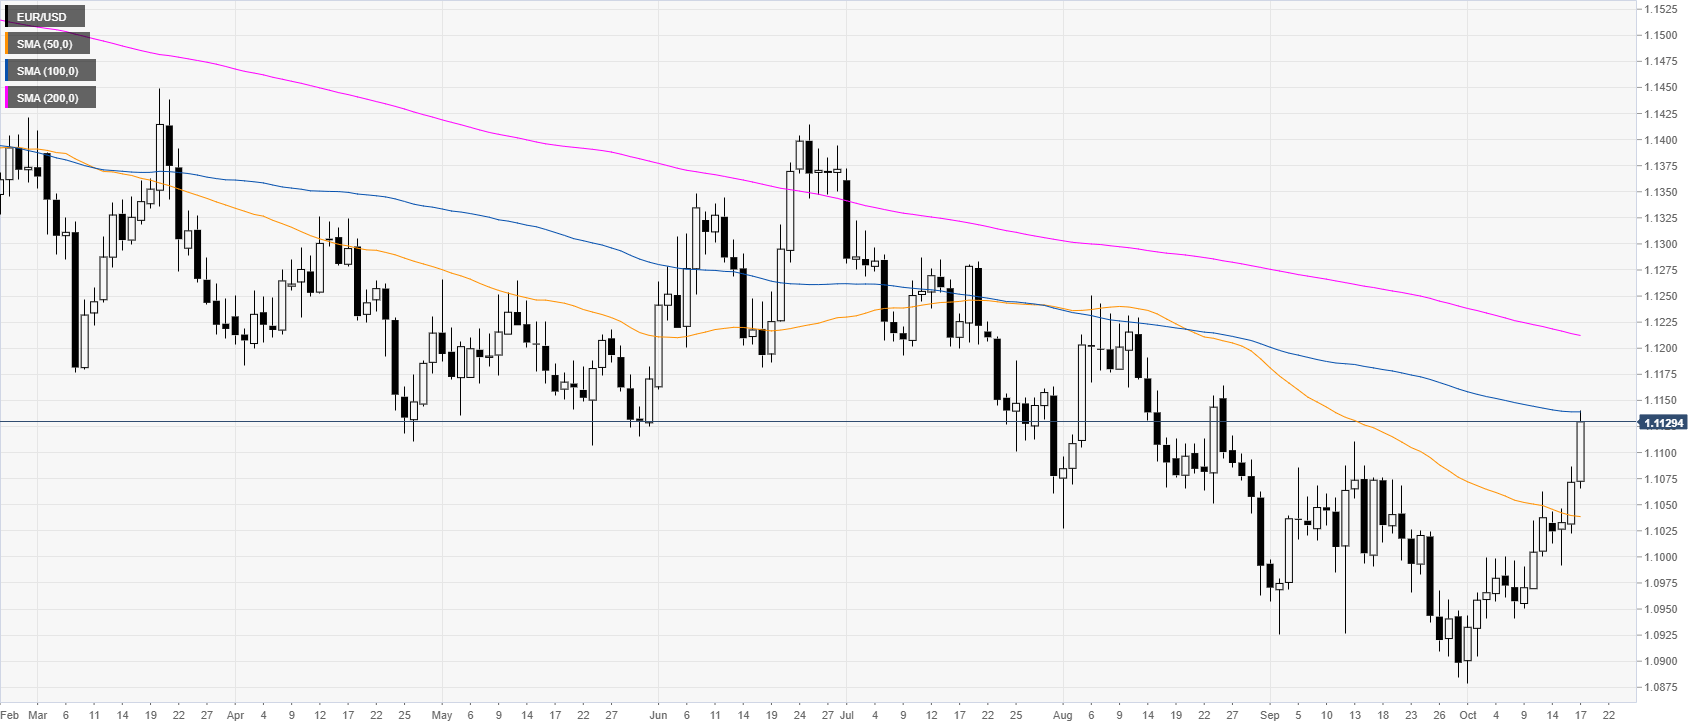
EUR/USD daily chart
On the daily chart, the shared currency is trading in a downtrend below the 100 and 200-day simple moving averages (DSMAs). This Thursday, the Fiber is surpassing the September highs and challenging the 100 SMA.
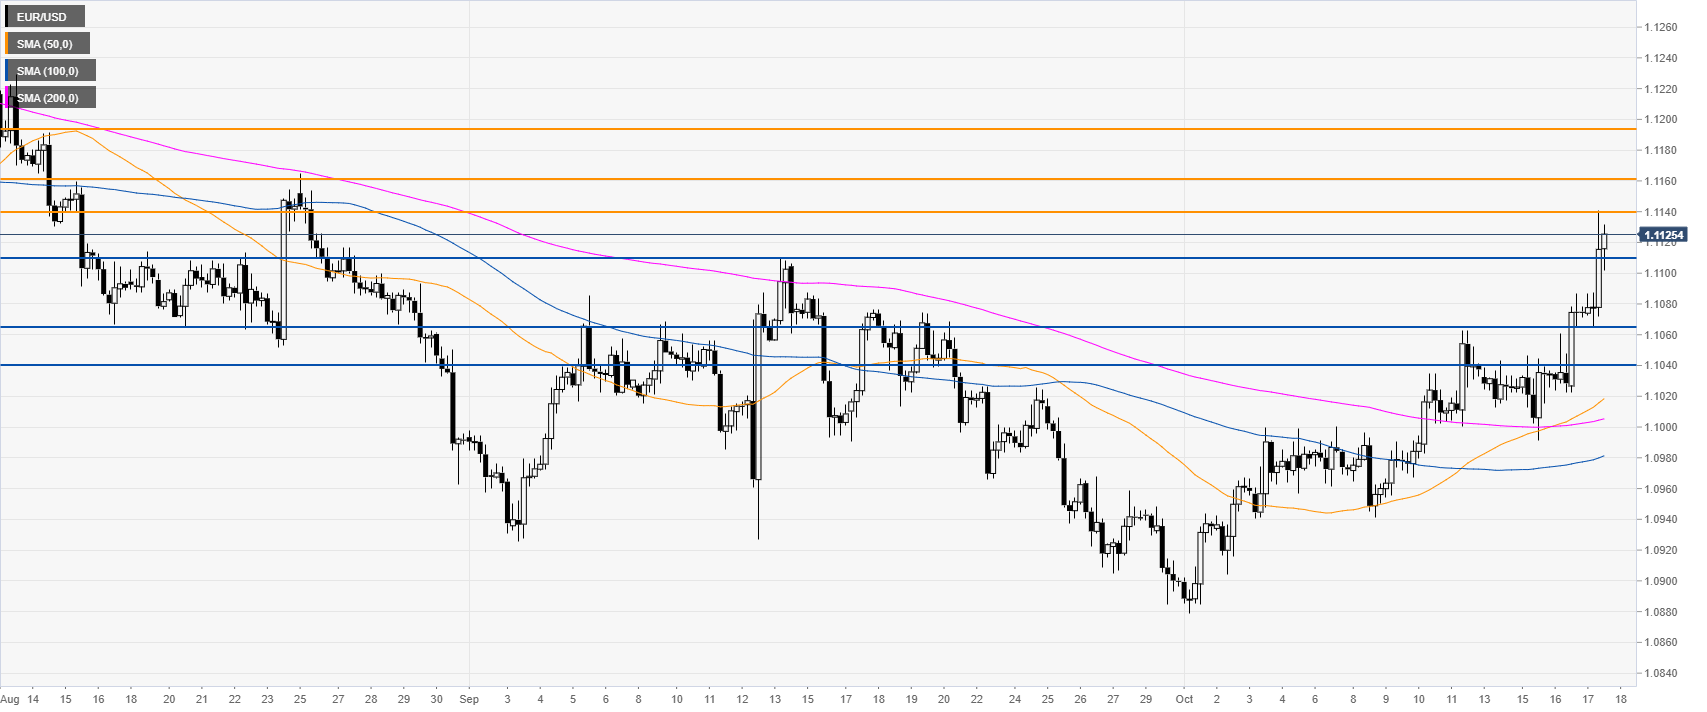
EUR/USD four-hour chart
The Fiber is trading above the main SMAs, suggesting bullish momentum in the medium term. EUR/USD is clinging to daily/weekly and monthly gains, hanging near September highs. A break above the 1.1140 resistance can open the doors to the 1.1160 and 1.1191 resistances on the way up, according to the Technical Confluences Indicator.
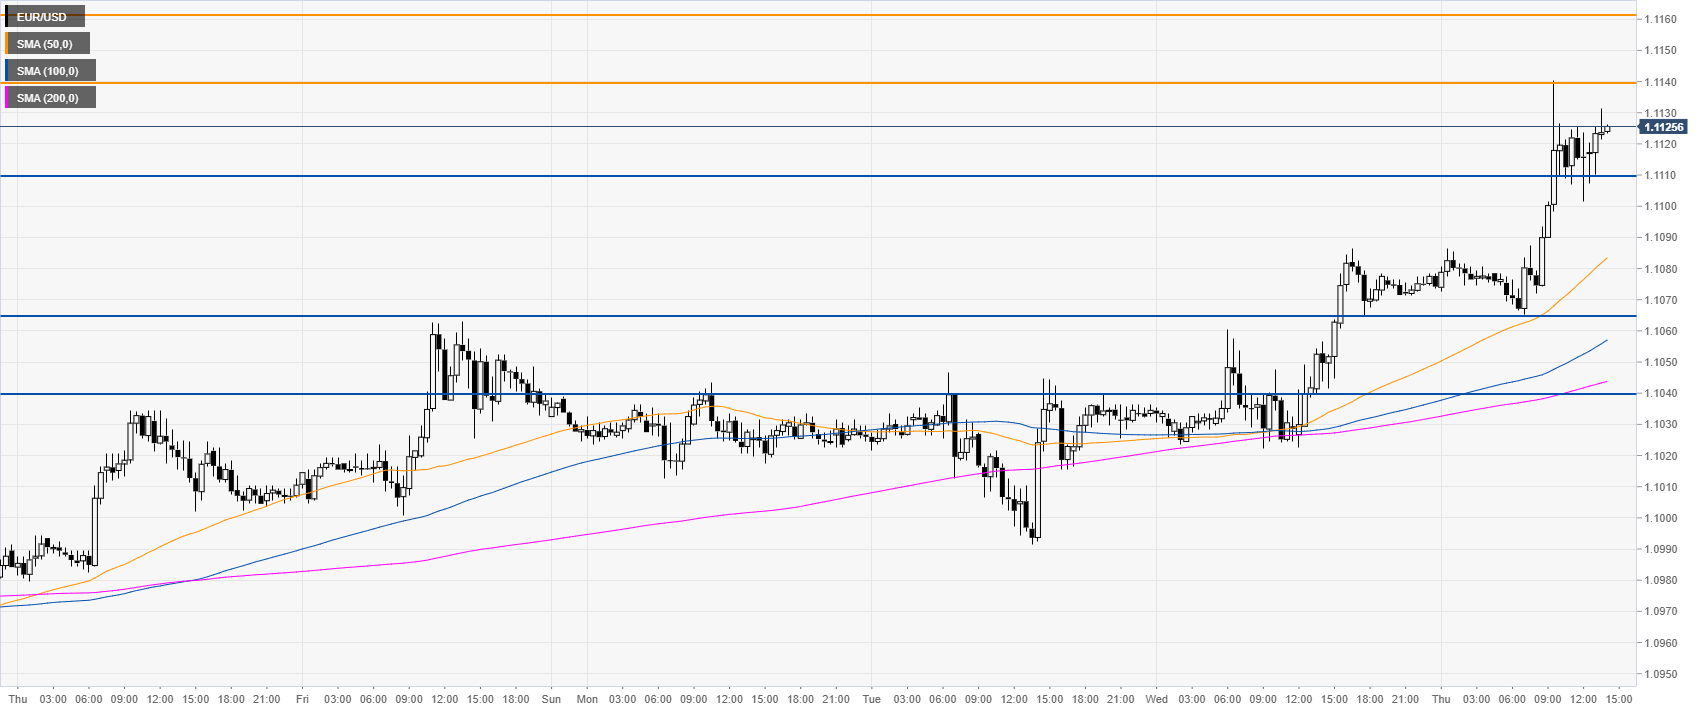
EUR/USD 30-minute chart
EUR/USD is trading above the main SMAs, suggesting bullish momentum in the near term. Support can be seen at 1.1110, 1.1064 and 1.1041 price levels.
Additional key levels
