- EUR/USD is trading in the 1.1020/1.1073 range ahead of the European Central Bank (ECB) meeting on Thursday.
- The key level to beat for bears is the 1.1020 support level.
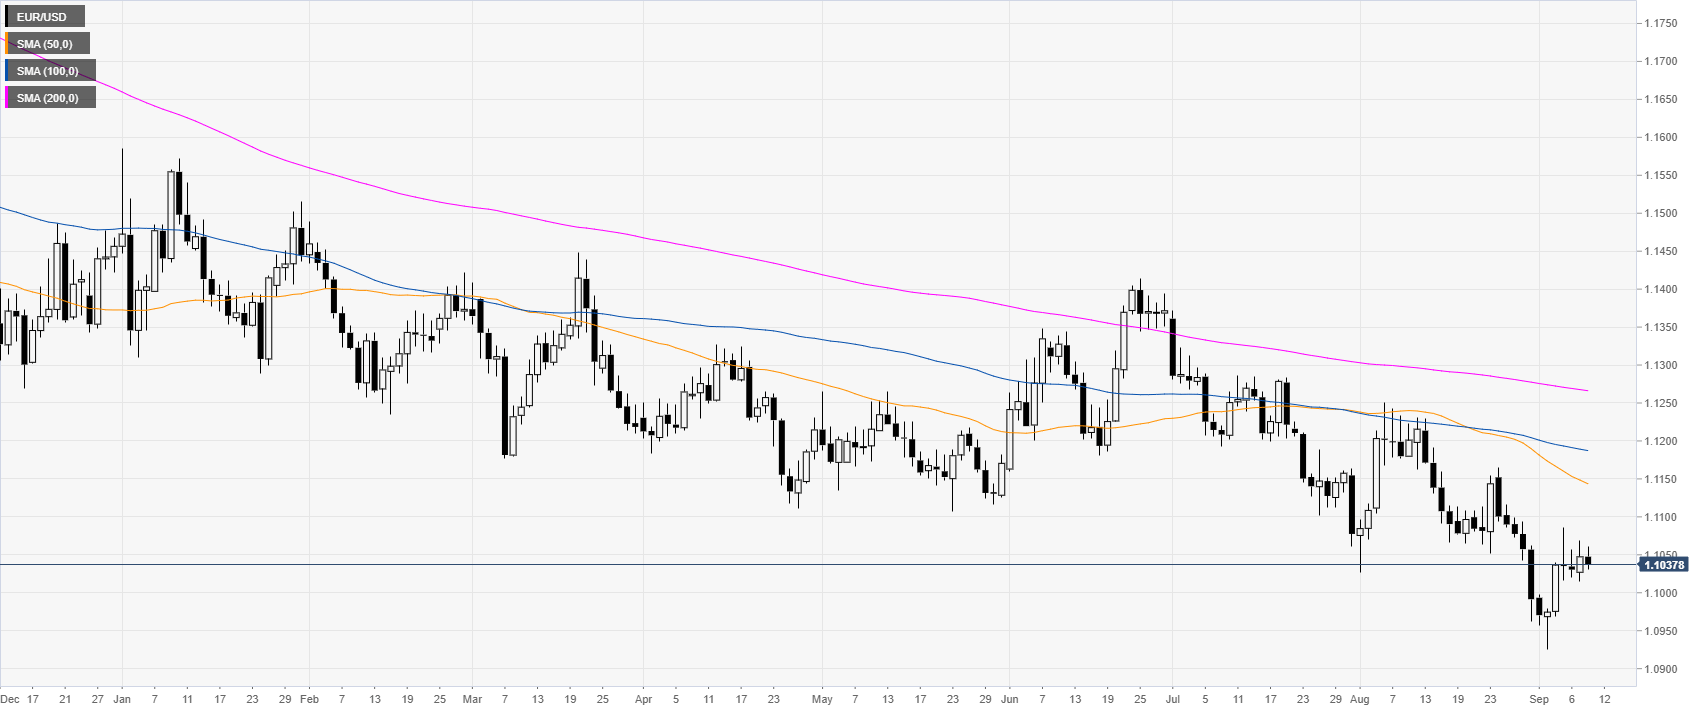
EUR/USD daily chart
On the daily time-frame, the common currency is trading in a bear trend below its main daily simple moving averages (DSMAs). The market is consolidating for its fourth consecutive day ahead of Thursday’s European Central Bank (ECB) meeting.
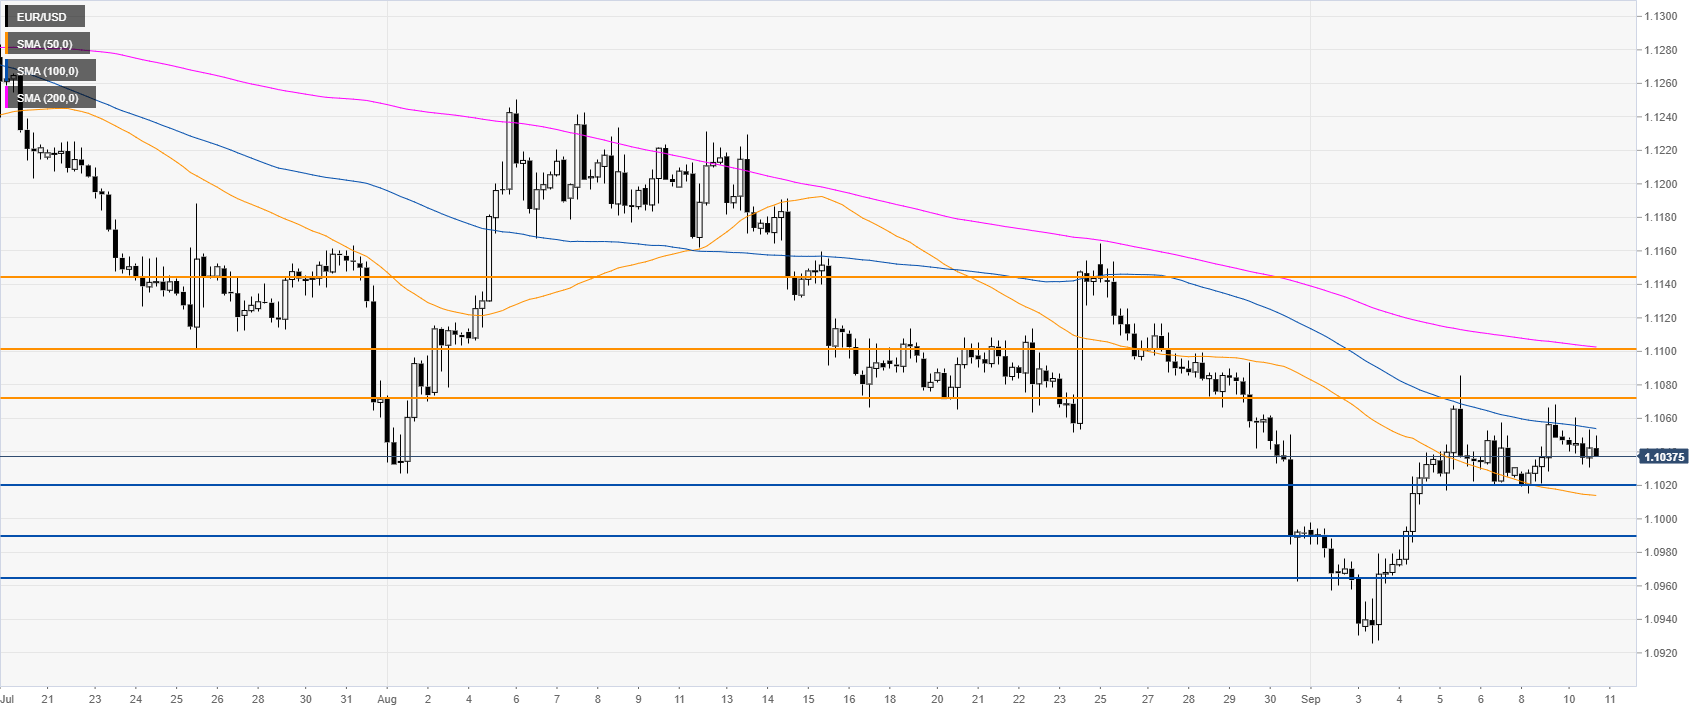
EUR/USD four-hour chart
EUR/USD keeps consolidating last week’s run-up in the 1.1020/1.1073 range. The Fiber is trading below the downward sloping 100 and 200 SMAs, suggesting bearish momentum in the medium term. Sellers will be looking for a break below 1.1020 support to potentially drive the market towards 1.0990 and 1.0964 price levels, according to the Technical Confluences Indicator.
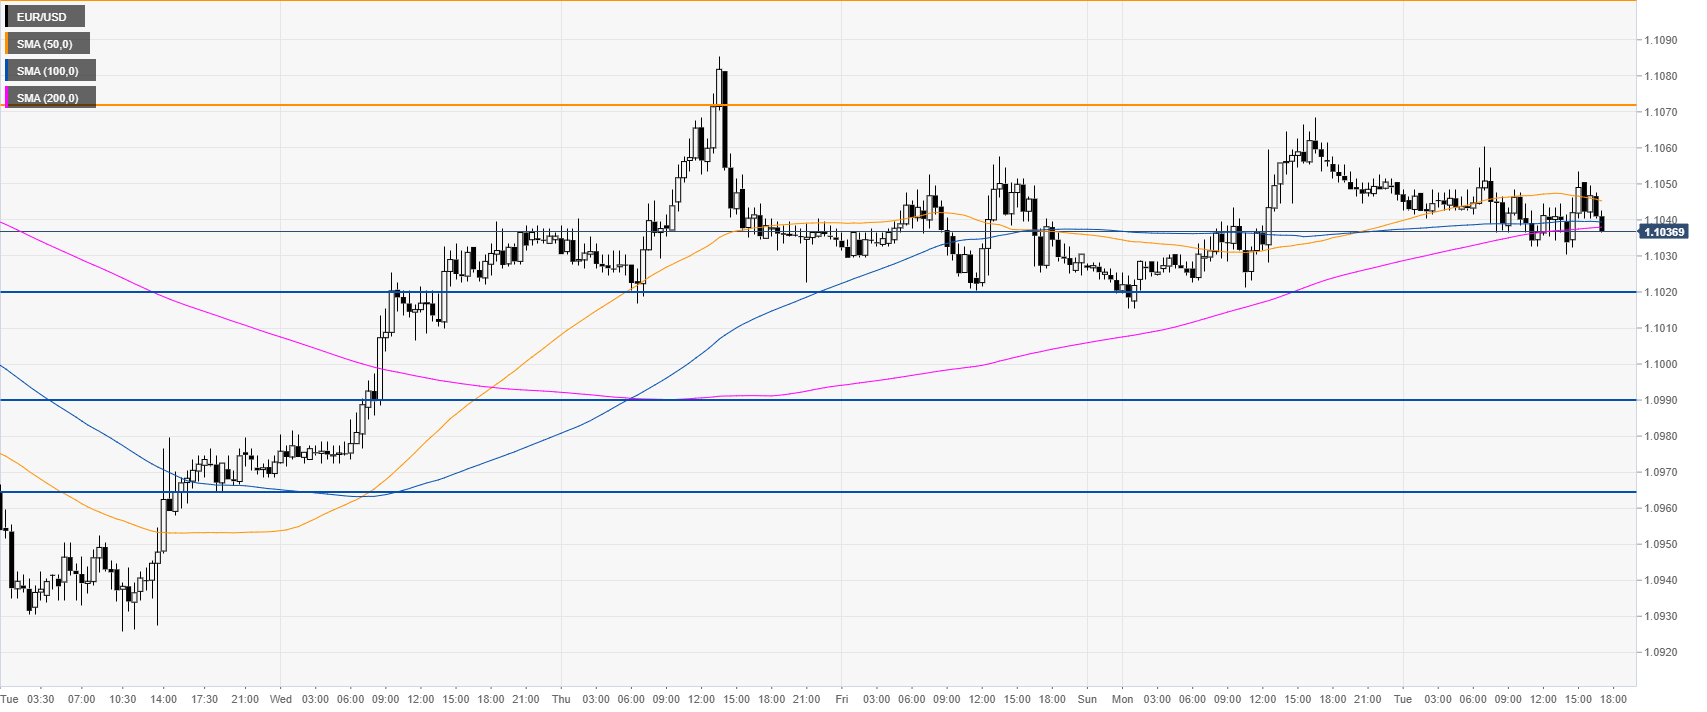
EUR/USD 30-minute chart
EUR/USD is trading in a tight range as it has spent most of the day between its SMAs. All-in-all suggesting a sideways market in the short term. Buyers would likely need a daily close above 1.1073 to attract further buying interest.
Additional key levels
