- EUR/USD is printing fresh weekly highs while the ADP disappointed.
- The level to beat for bulls is the 1.0960 resistance.
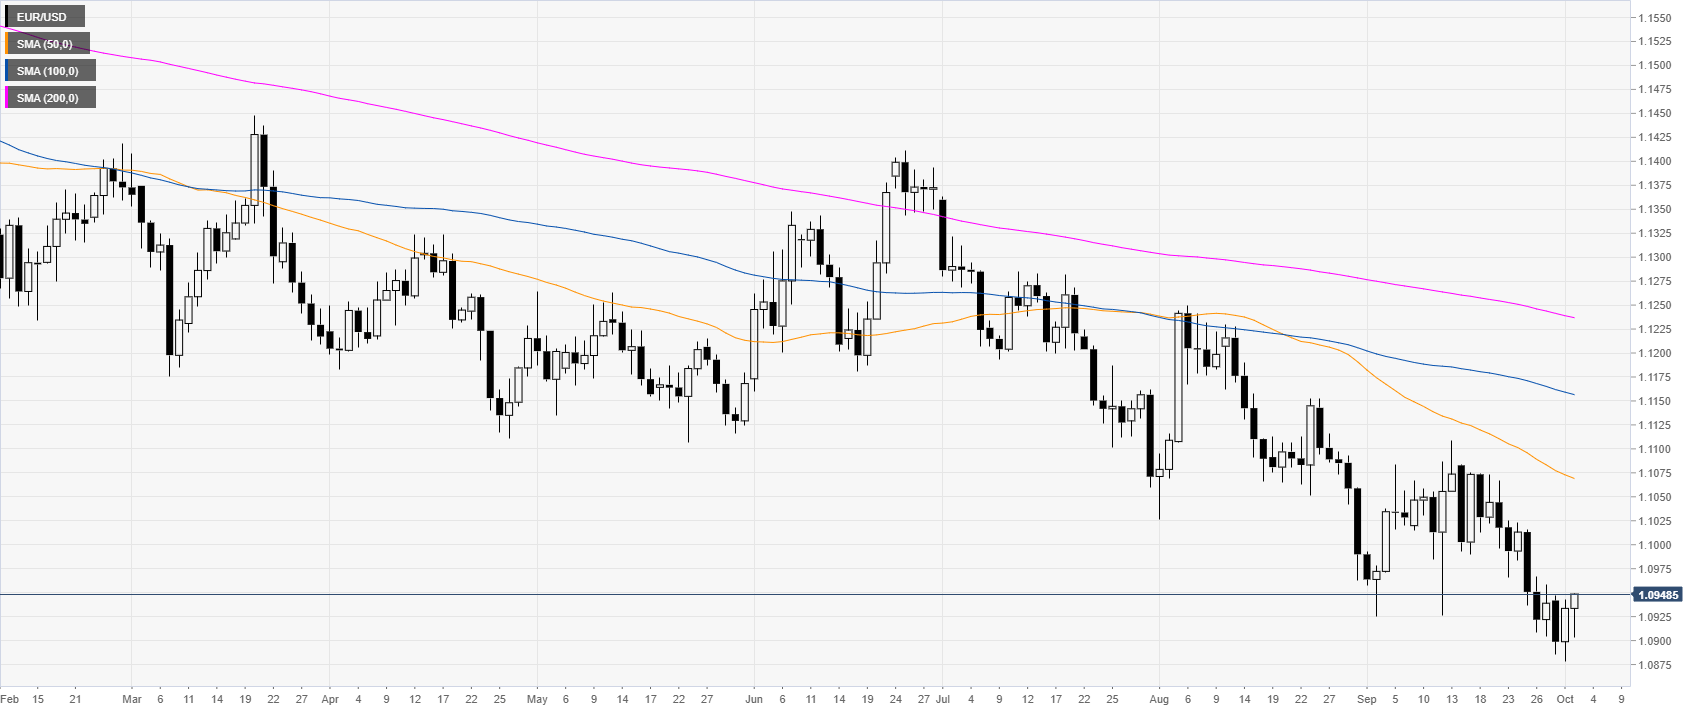
EUR/USD daily chart
The shared currency, on the daily chart, is trading in a bear trend below the main daily simple moving averages (DSMAs). This Wednesday, the ADP, the forerunner of the Nonfarm Payrolls on Friday disappointed with only 135k vs. 140k expected in September.
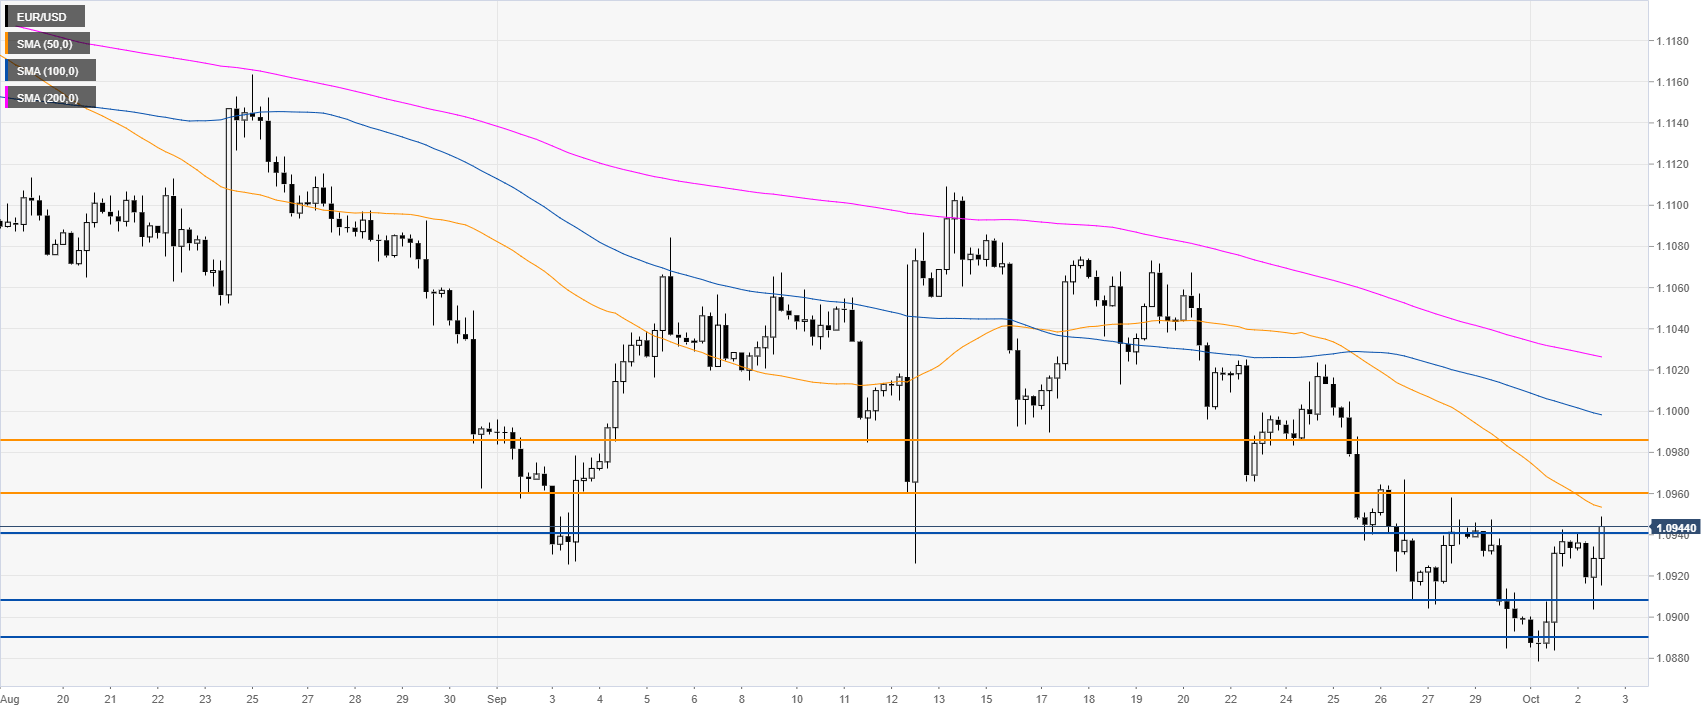
EUR/USD four-hour chart
EUR/USD is trading below the main SMAs, suggesting bearish momentum in the medium term. However, the break above 1.0940 can expose the 1.0960/85 resistance zone, according to the Technical Confluences Indicator.
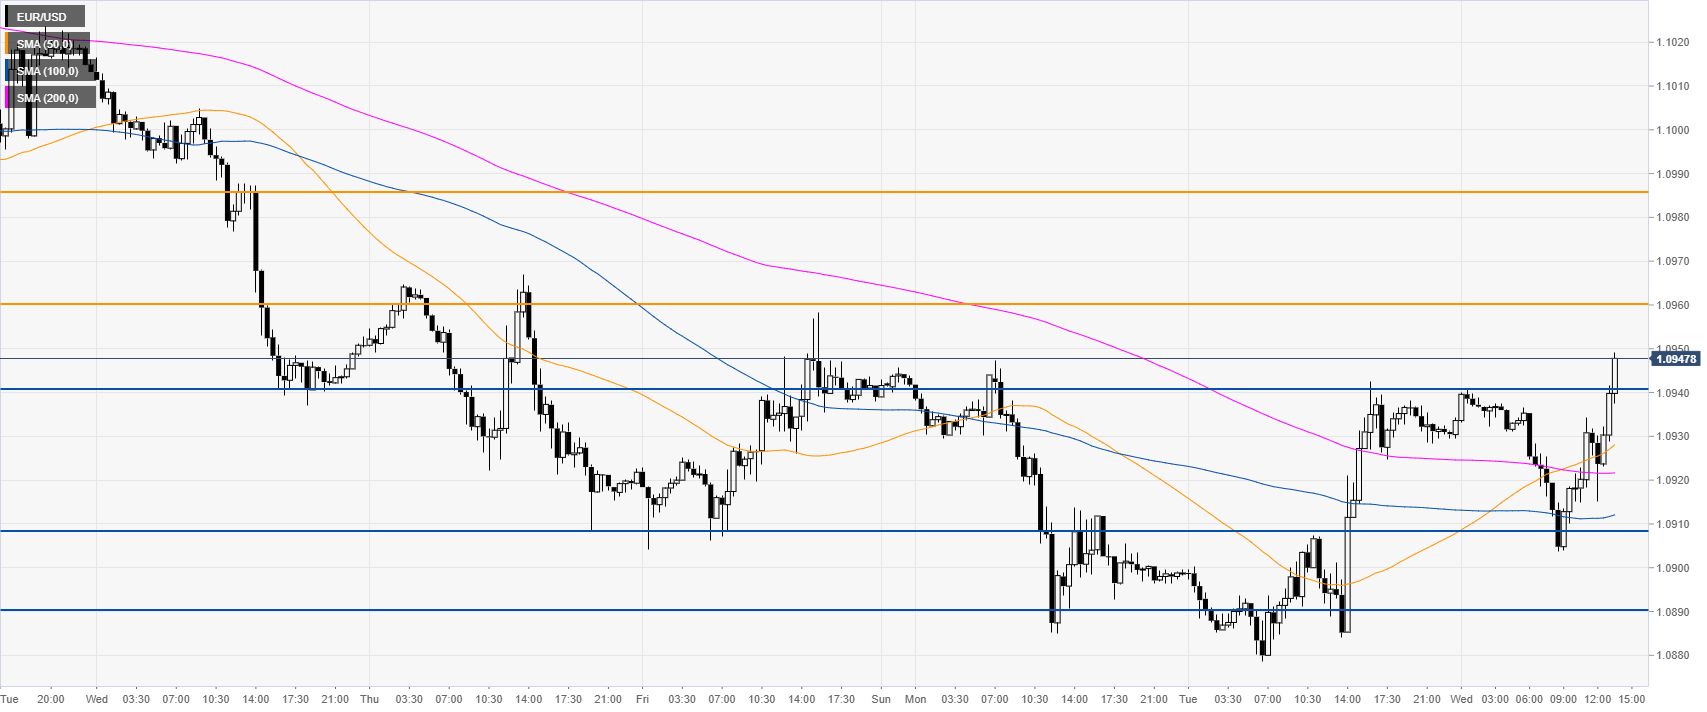
EUR/USD 30-minute chart
EUR/USD is trading above the main SMAs, suggesting bullish momentum in the near term. Immediate support is seen at the 1.0940 and 1.0908 level, according to the Technical Confluences Indicator.
Additional key levels
