- EUR/USD starts the week with a modest advance to the 1.1070 level.
- EUR/USD is currently correcting the early November decline.
- Resistance is seen at 1.1075, followed by the 1.1110 level.
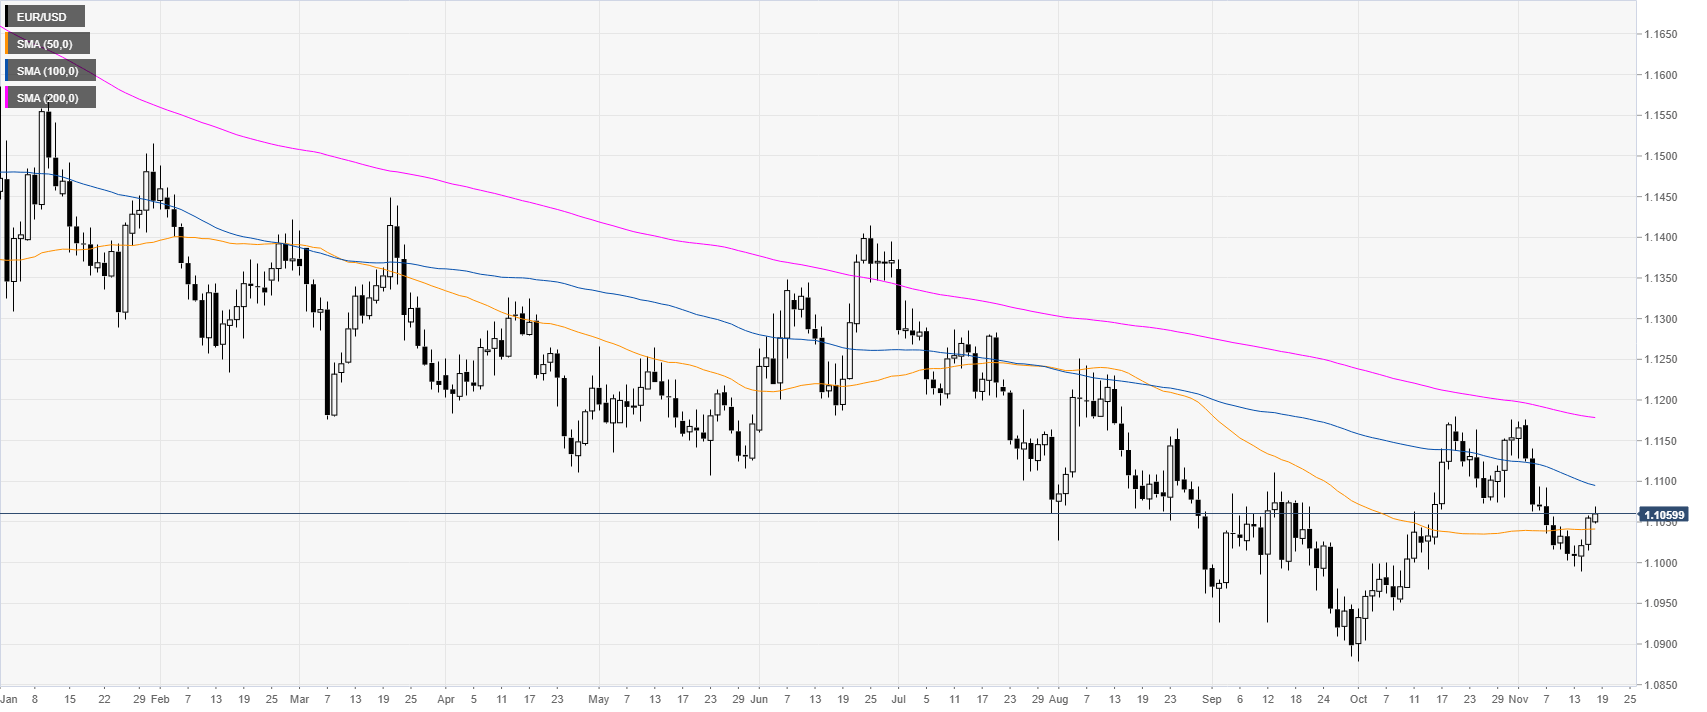
EUR/USD daily chart
The Fiber, on the daily chart, is trading in a downtrend below downward sloping 100 and 200-day simple moving averages (DMAs). Last week the spot corrected to the upside and moved above the 50 DMA today at 1.1041. The market also neared the 1.1060 level, which is the 38.2 Fibonacci retracement from the current November drop.
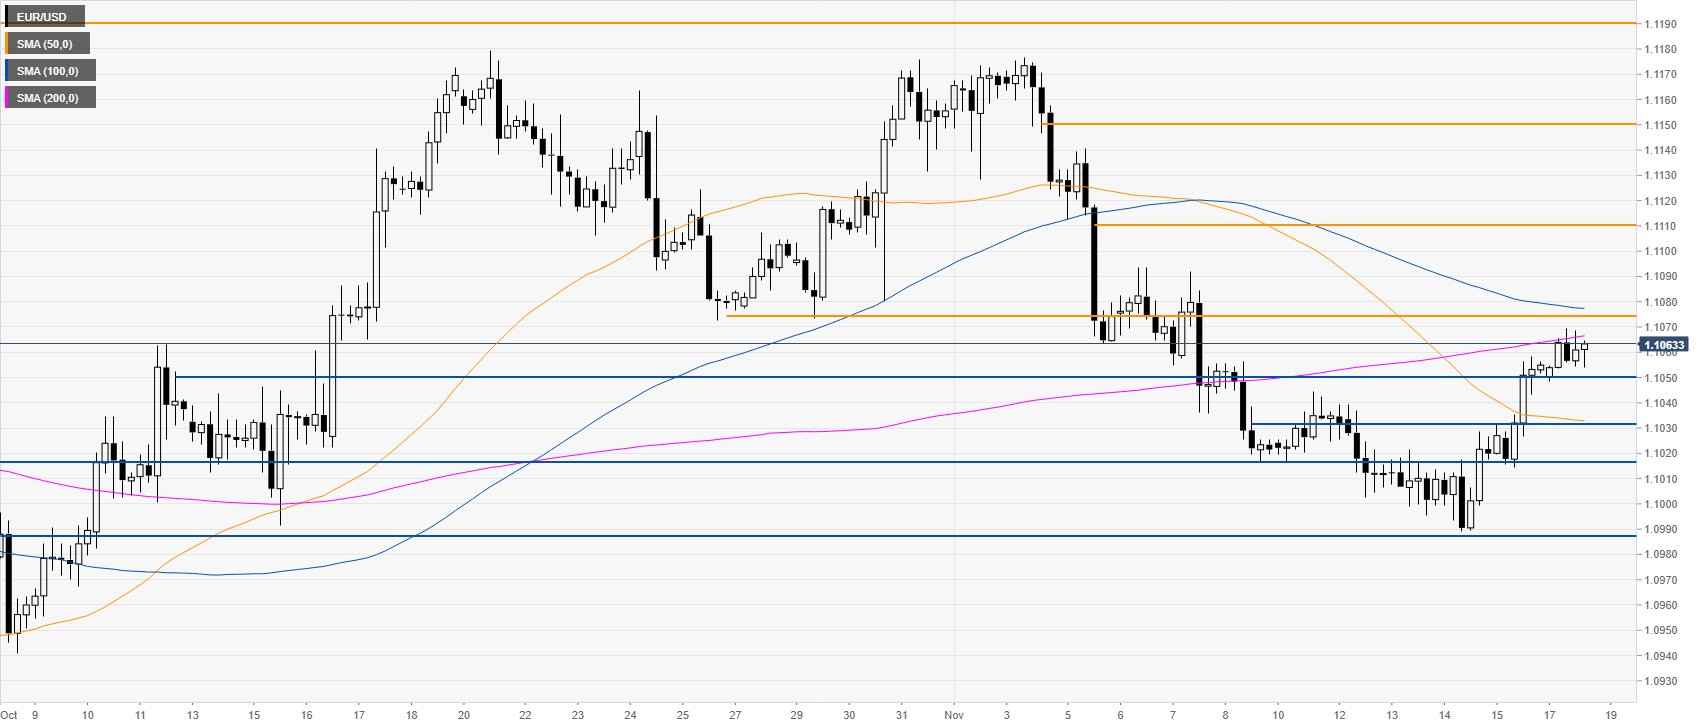
EUR/USD four-hour chart
The Fiber is correcting up as it moved beyond the 50 SMA. The market is trading below the 1.1075 resistance near the 200 SMA. If the market is able to overcome this level, the next level of resistance might come in at the 1.1110 and 1.1150 levels. Further up lie the 1.1190 resistance.
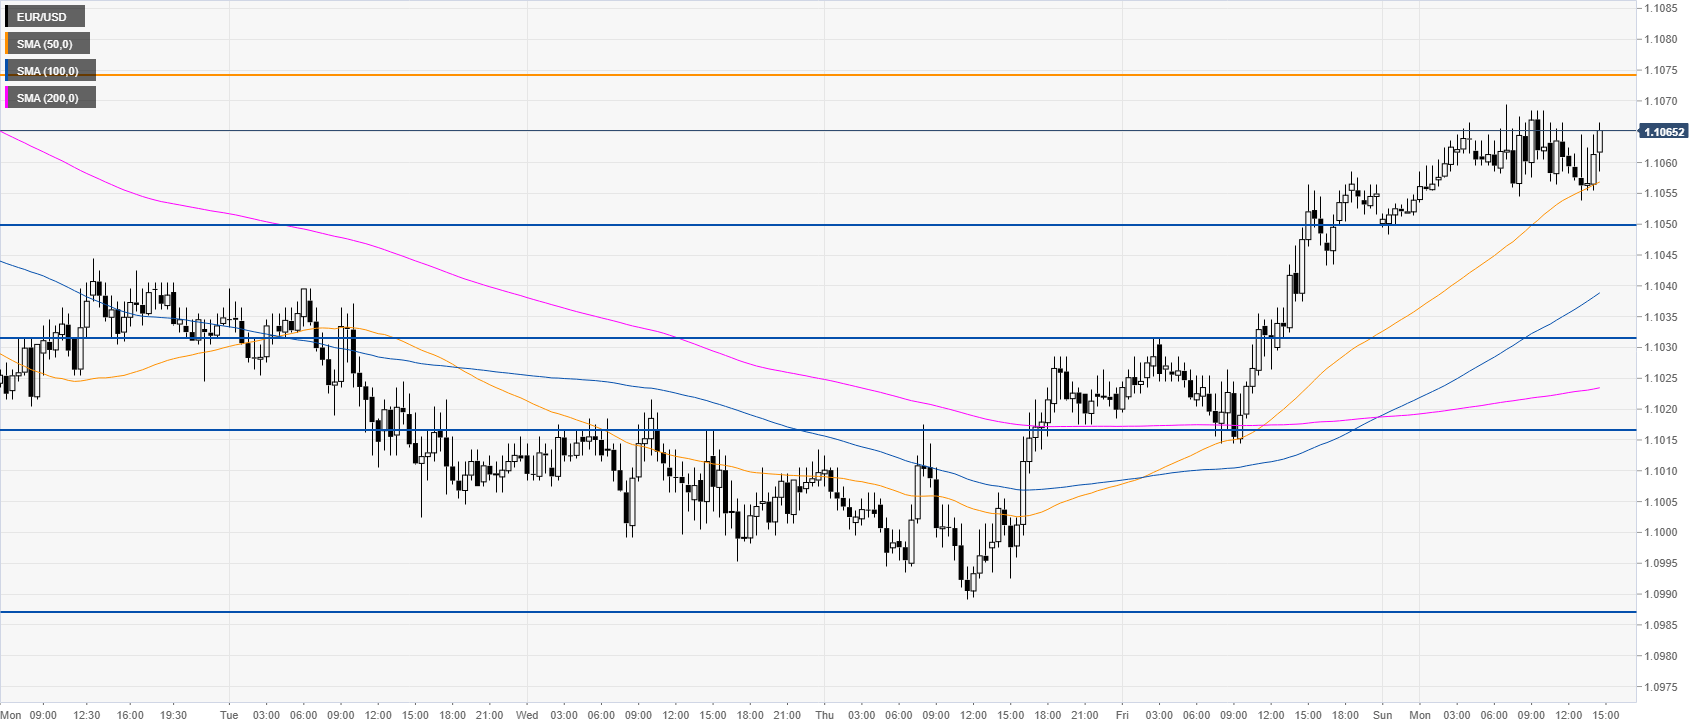
EUR/USD 30-minute chart
EUR/USD is trading in a tight range above its main SMAs, suggesting a bullish bias in the near term. Support is seen at the 1.1050, 1.1032 and 1.1016 support levels. Further down, 1.0986 is likely the level to beat for bears to resume the bear trend.
Additional key levels
