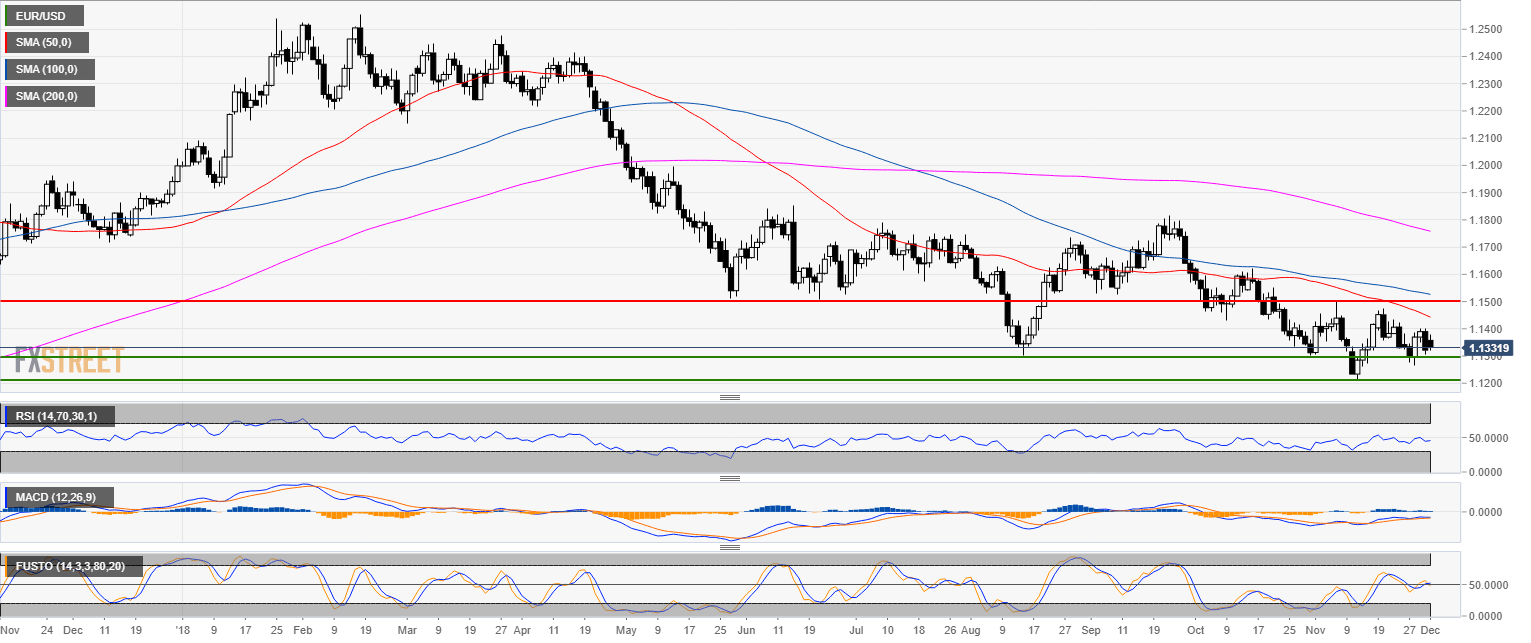
EUR/USD daily chart
- EUR/USD is trading in a bear trend below the 200-day simple moving average (SMA).
- EUR/USD is trading above the 1.1300 figure which was an important level in the past weeks of trading.
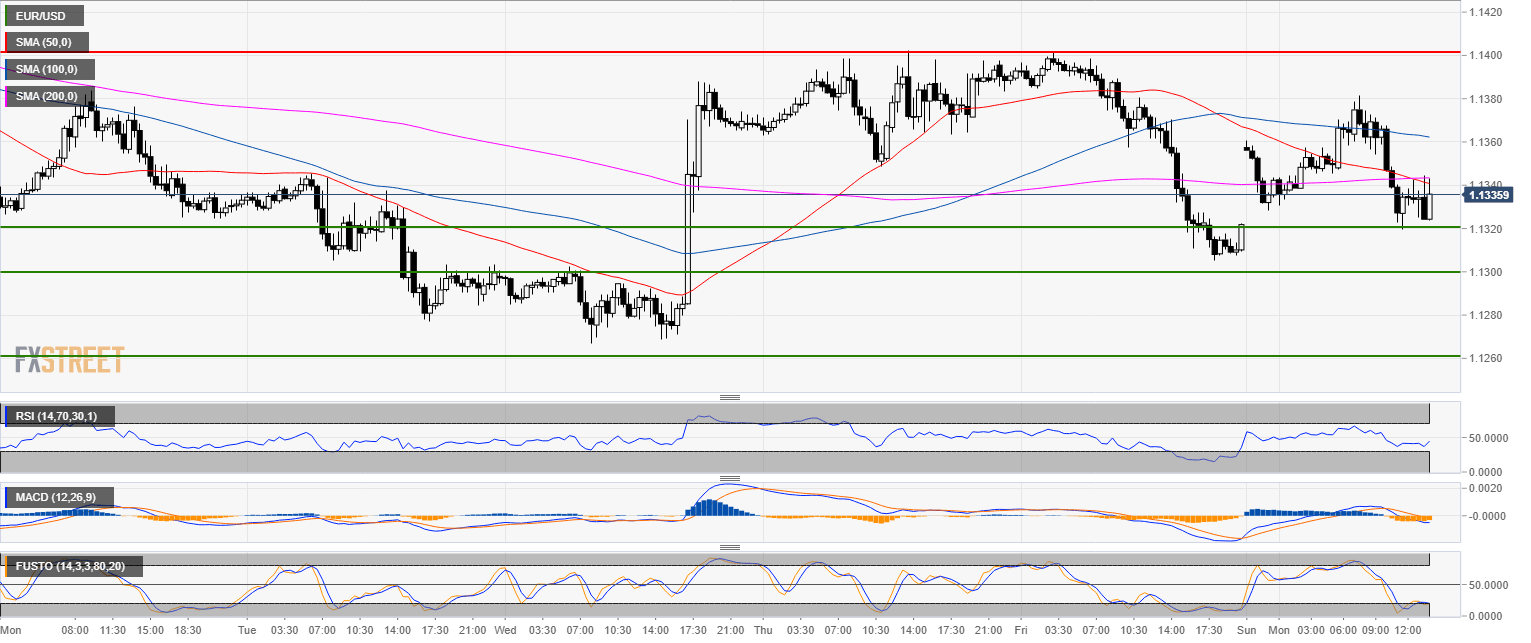
EUR/USD 4-hour chart
- EUR/USD is trading below its main SMAs.
- EUR/USD is essentially trading inside Friday’s range as technical indicators have a slight bearish bias.

EUR/USD 30-minute chart
- EUR/USD is finding some support at 1.1320 as it is trading below its main SMAs.
- The picture is for the moment fairly balanced with both bulls and bears having valid arguments. The market is trapped between the 1.1300 and 1.1400 figure. A break in either direction is needed to confirm the short-term directional bias.
Additional key levels
EUR/USD
Overview:
Today Last Price: 1.1336
Today Daily change: 14 pips
Today Daily change %: 0.124%
Today Daily Open: 1.1322
Trends:
Previous Daily SMA20: 1.136
Previous Daily SMA50: 1.1451
Previous Daily SMA100: 1.153
Previous Daily SMA200: 1.1765
Levels:
Previous Daily High: 1.1402
Previous Daily Low: 1.1305
Previous Weekly High: 1.1402
Previous Weekly Low: 1.1267
Previous Monthly High: 1.15
Previous Monthly Low: 1.1216
Previous Daily Fibonacci 38.2%: 1.1342
Previous Daily Fibonacci 61.8%: 1.1365
Previous Daily Pivot Point S1: 1.1284
Previous Daily Pivot Point S2: 1.1247
Previous Daily Pivot Point S3: 1.1188
Previous Daily Pivot Point R1: 1.138
Previous Daily Pivot Point R2: 1.1439
Previous Daily Pivot Point R3: 1.1477
