- EUR/USD drops sharply to fresh 2019 lows following the cut from the Federal Reserve.
- The level to beat for bears are seen at the 1.1064, 1.1030 and 1.007 levels.
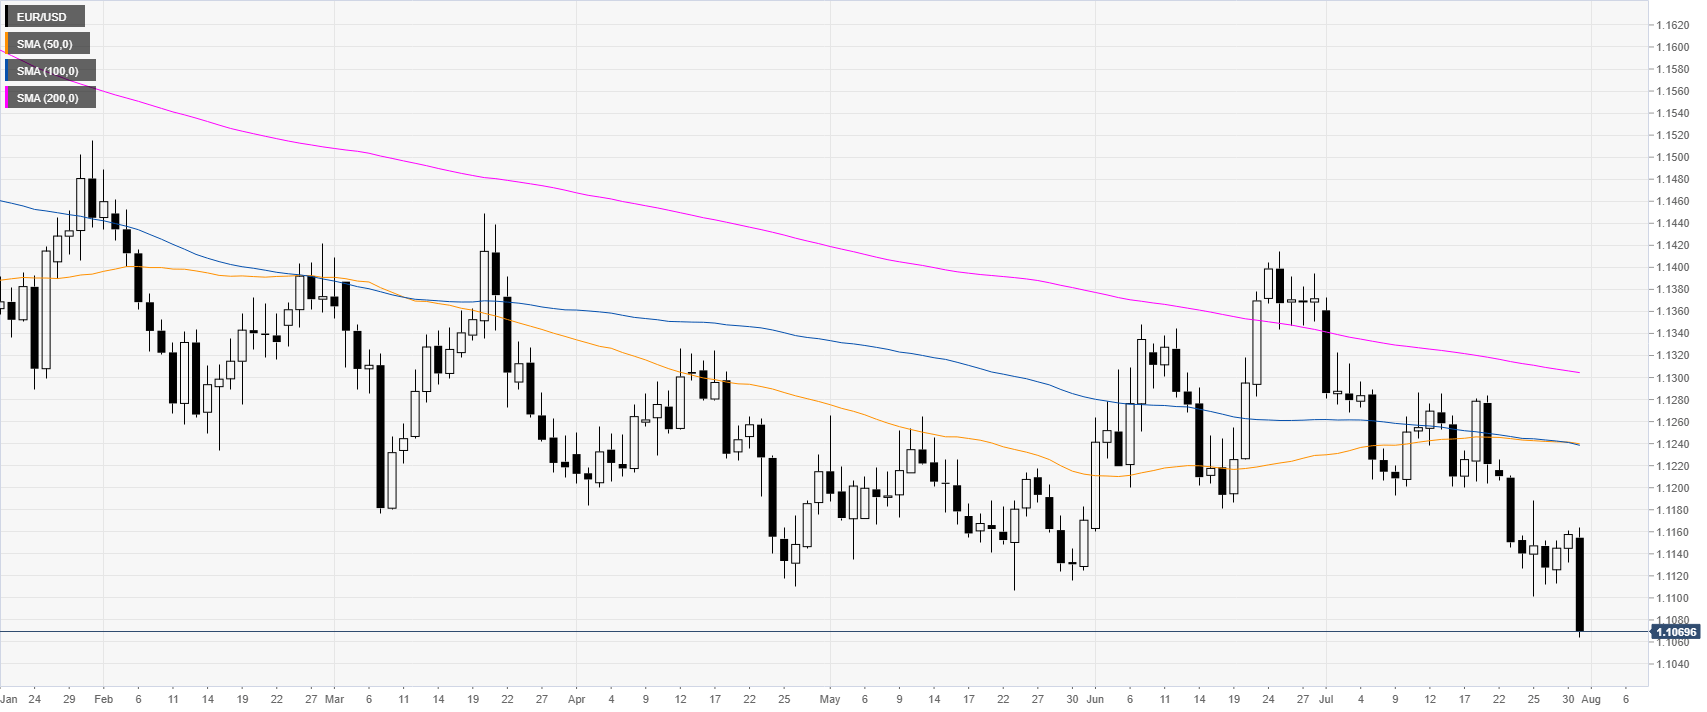
EUR/USD daily chart
EUR/USD is in a bear trend below its main daily simple moving averages (DSMAs). The Federal Reserve cut 25 bps as market participants widely expected it. The market fell sharply on the news.
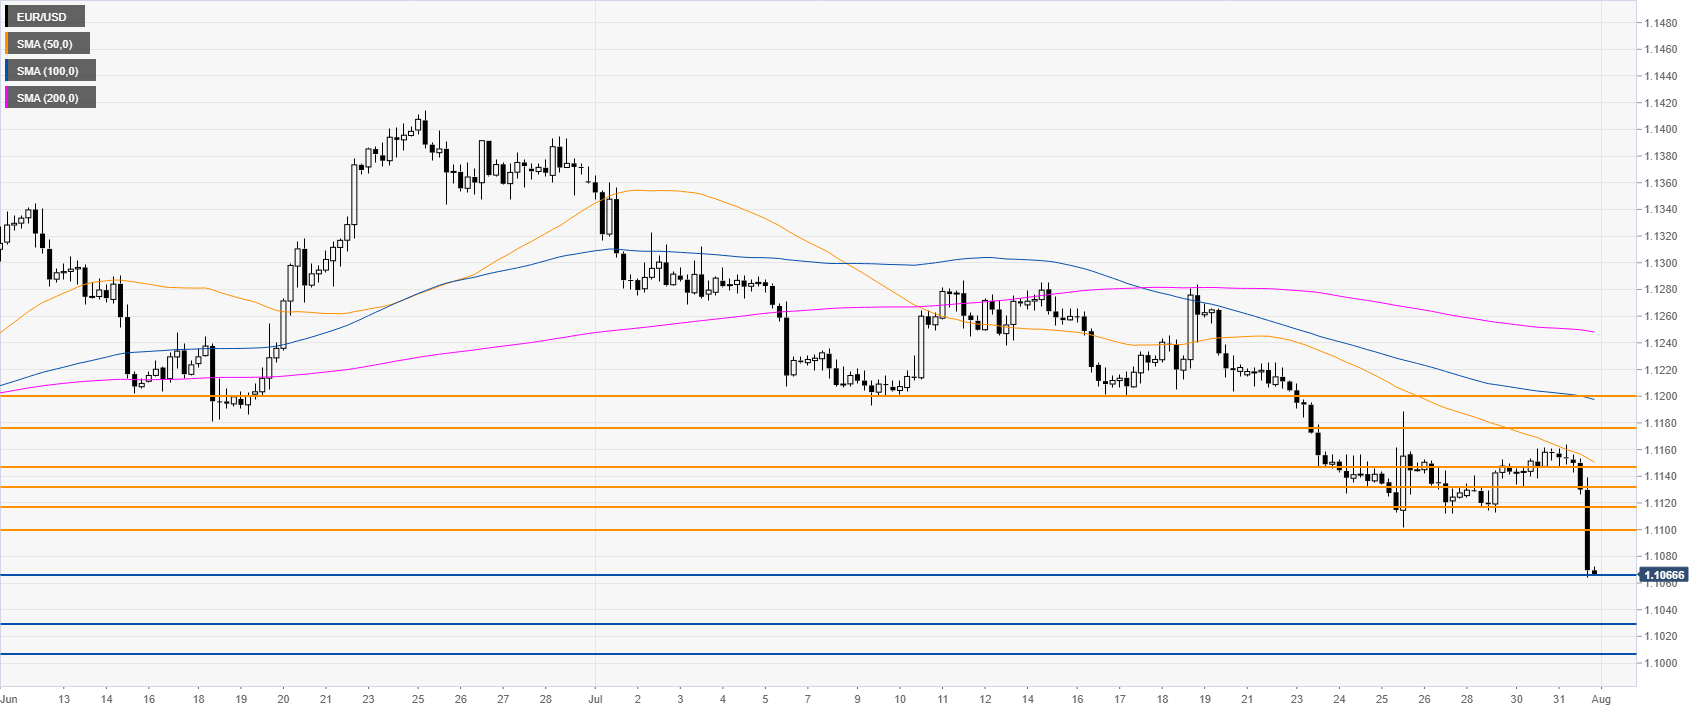
EUR/USD 4-hour chart
EUR/USD is trading below its major SMAs, suggesting a bearish bias in the medium term. The market reached 1.1060, its lowest point in 2019. Sellers want to break below this level to travel south towards 1.1030 and 1.1007, according to the Technical Confluences Indicator.
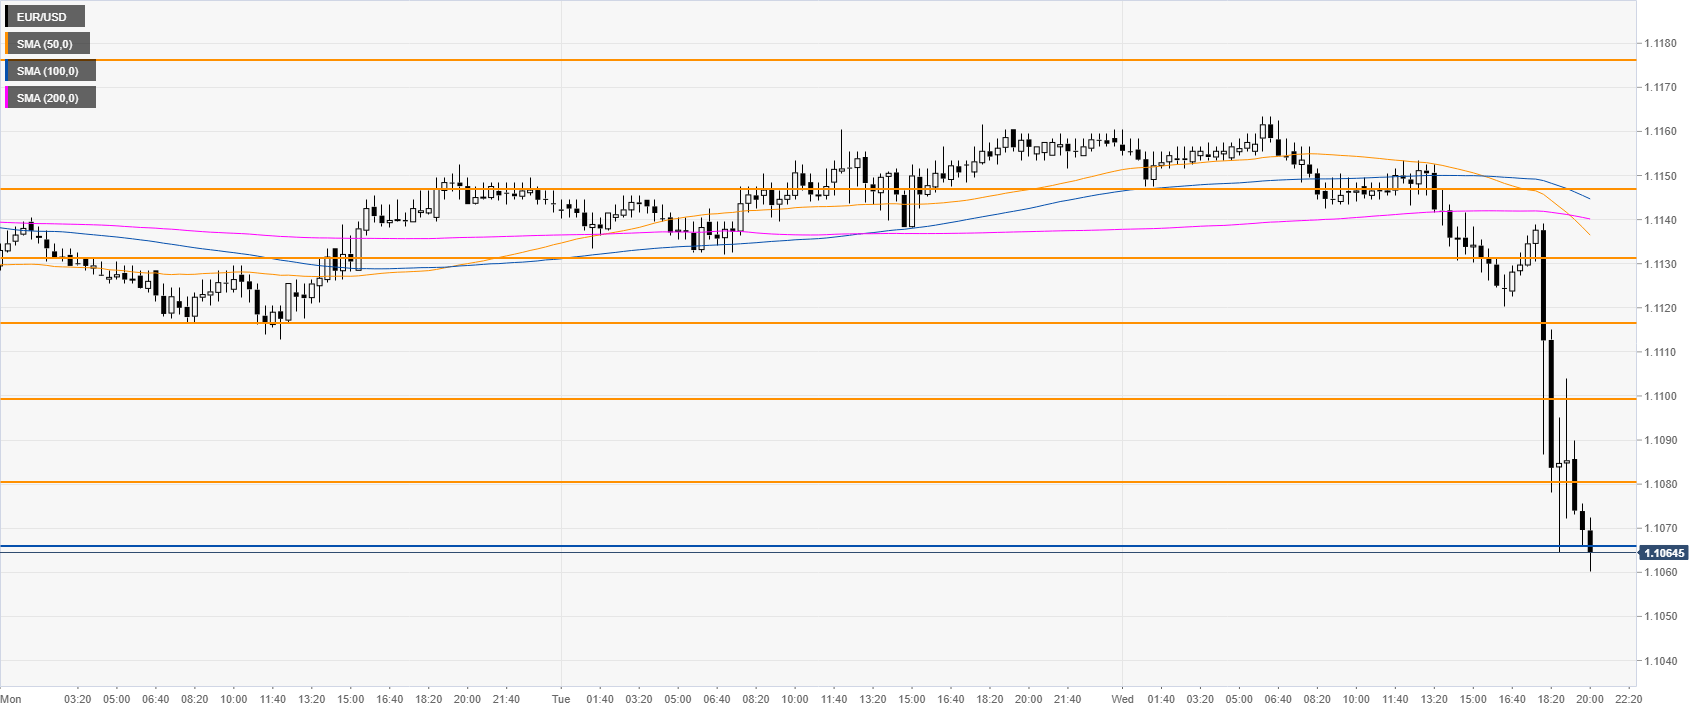
EUR/USD 30-minute chart
EUR/USD is steeply down below its SMAs, suggesting bearish momentum in the short term. Immediate resistances are located at 1.1080, 1.1100 and 1.1117 according to the Technical Confluences Indicator.
Additional key levels
