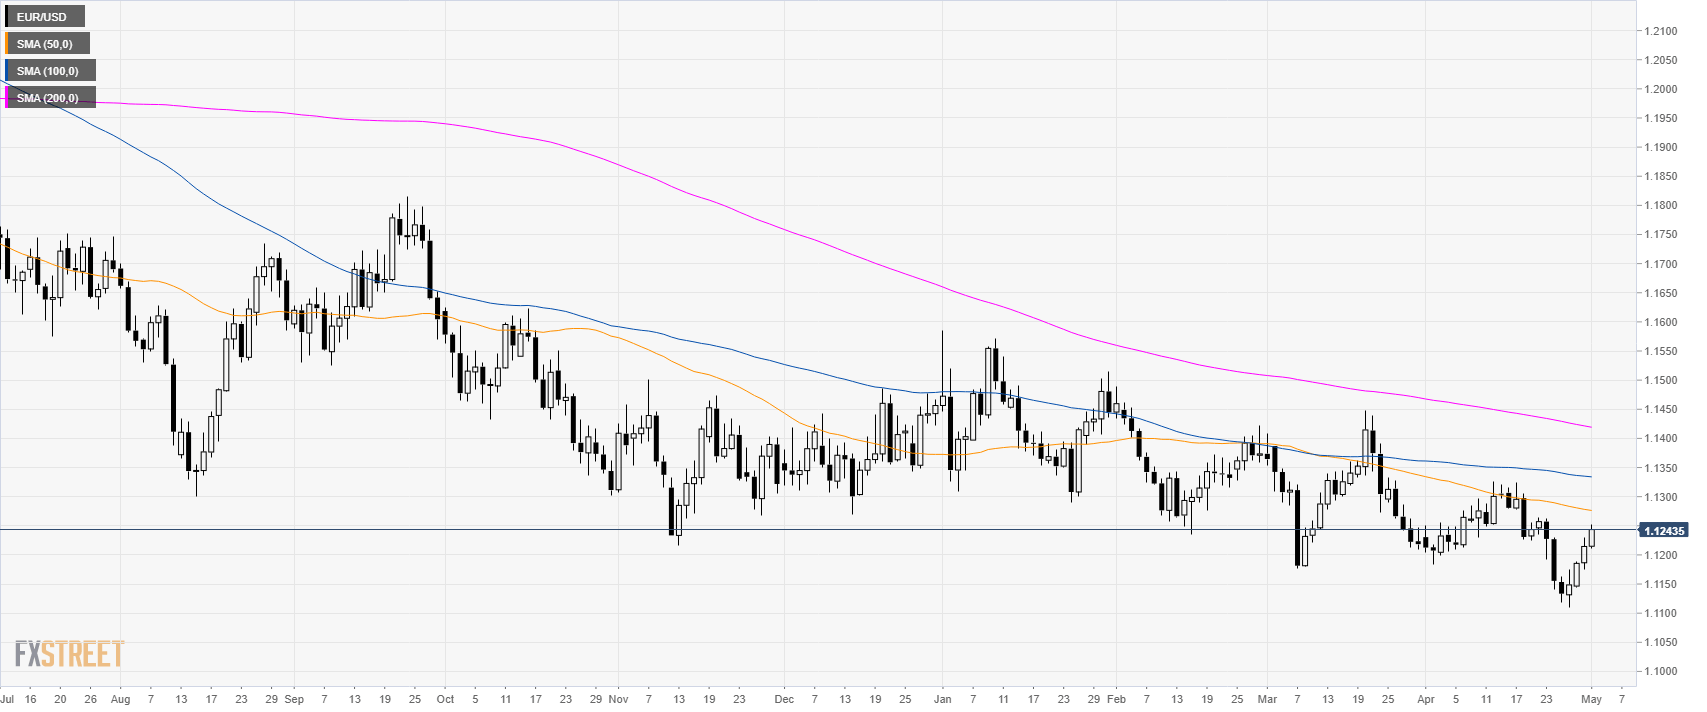
EUR/USD daily chart
- EUR/USD is evolving in a bear trend below its main simple moving average (SMAs).
- EUR/USD is having correction up from the 1.1100 level.
- Market participants will closely be monitoring the Federal Reserve Monetary Policy Statement at 18:00 GMT.
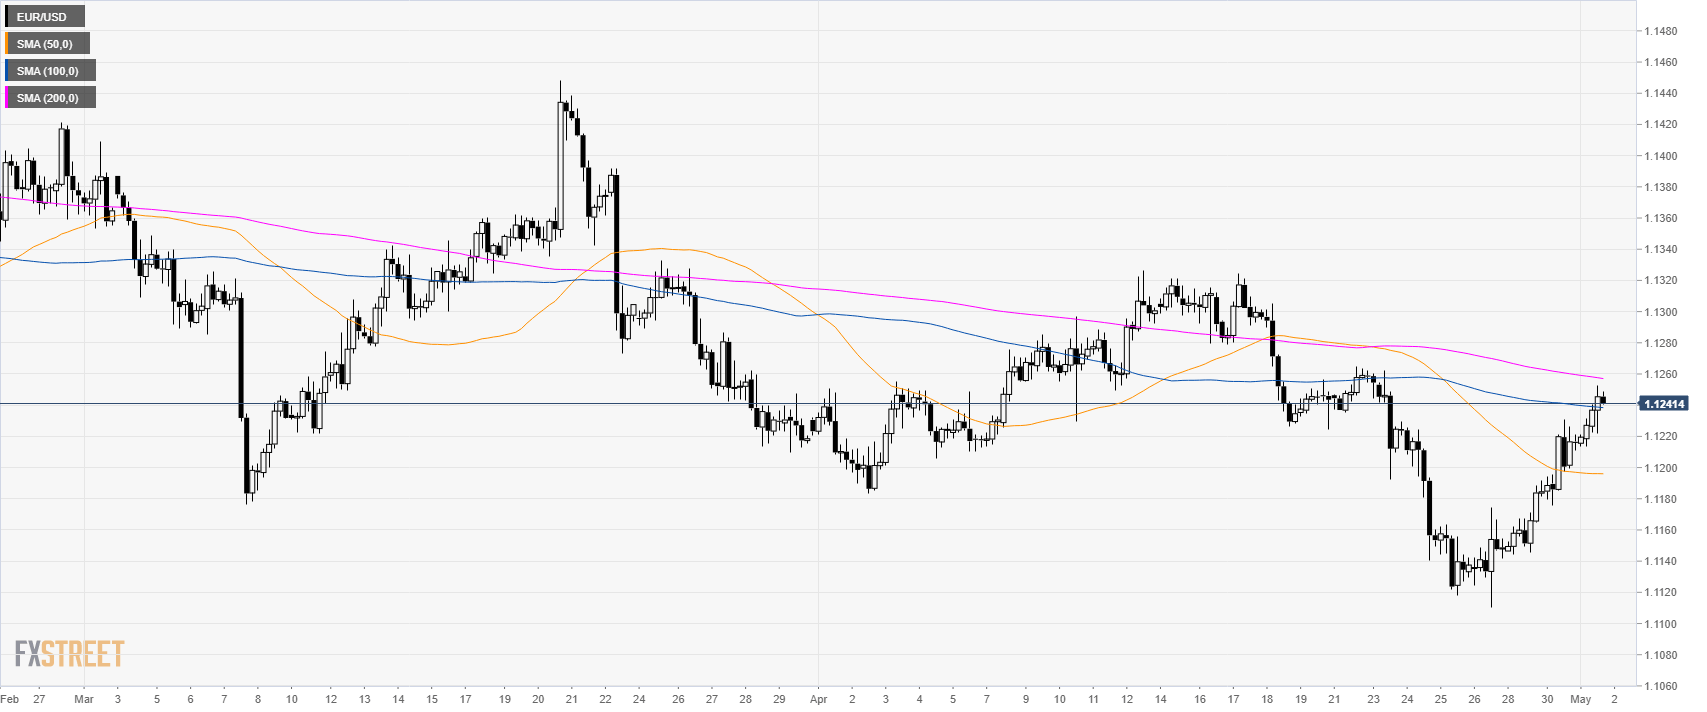
EUR/USD 4-hour chart
- EUR/USD is challenging the 1.1250 resistance and the 100 SMA.
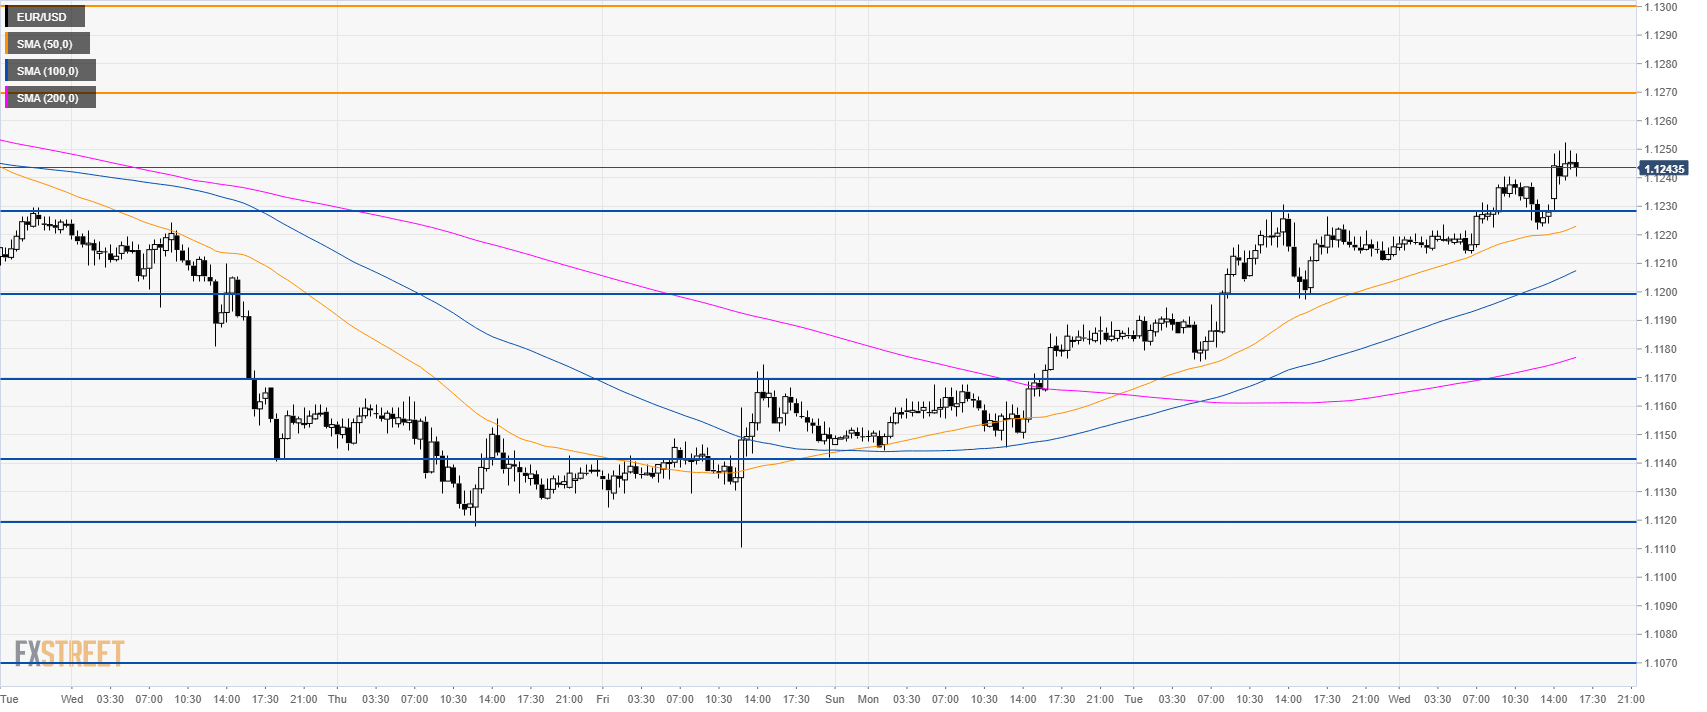
EUR/USD 30-minute chart
- EUR/USD is trading above its main SMAs suggesting bullish momentum in the short-term.
- The key resistance to the upside is seen at the 1.1270 level followed by 1.1300 figure if the bulls gather enough steam.
- Alternatively, a break below 1.1200 would be seen as bearish as it can initially expose 1.1170 and 1.1140 supports.
Additional key levels
