- EUR/USD climbed as high as 1.1097 but bears stepped in and drove the market near 1.1070 level.
- The level to beat for bears is the 1.1043 support.
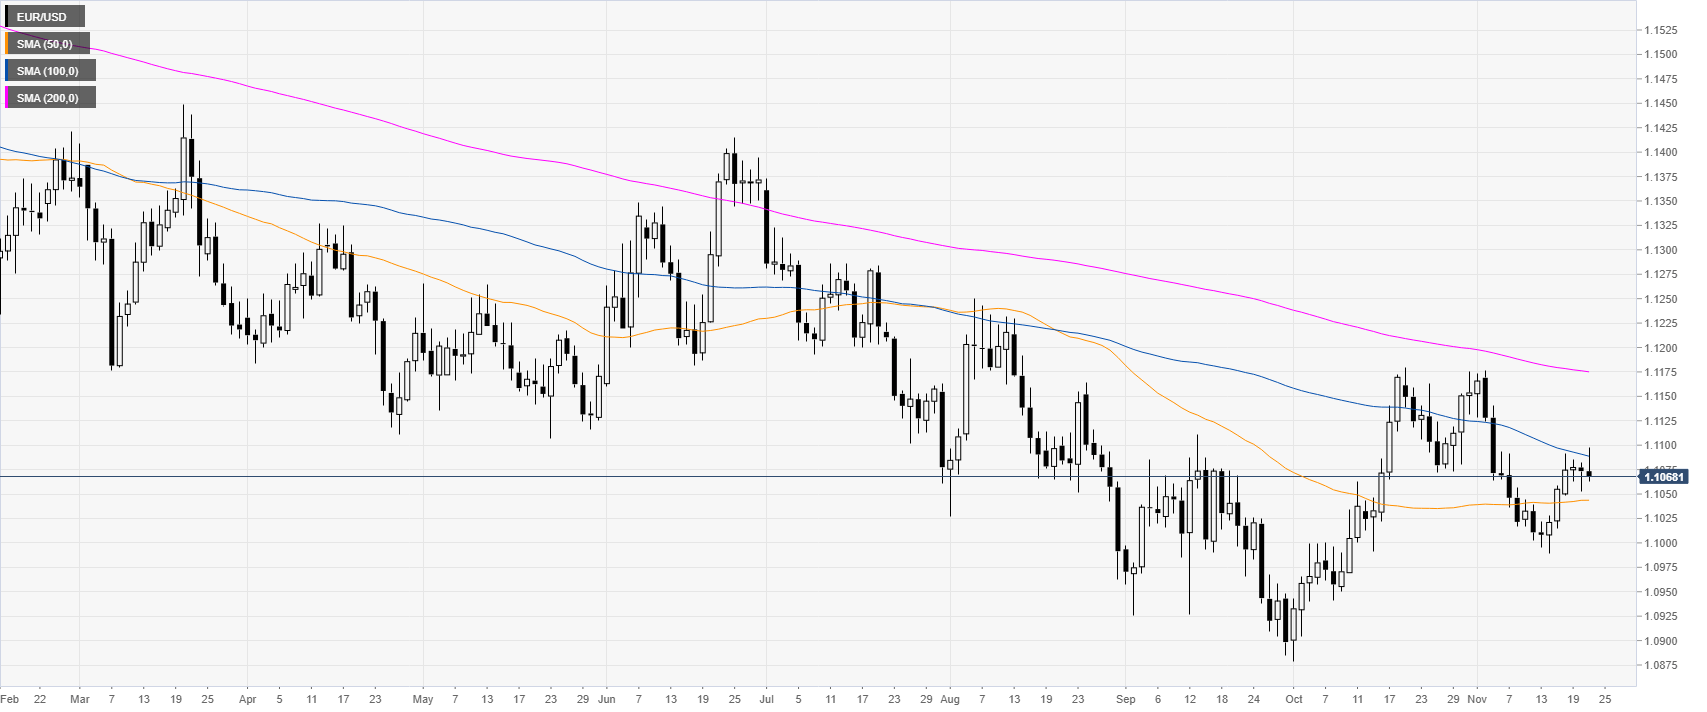
EUR/USD daily chart
EUR/USD, on the daily chart, is trading in a downtrend below downward sloping 100 and 200-day simple moving averages (DMAs). The market is rejecting the 1.1100 handle this Thursday in the New York session.
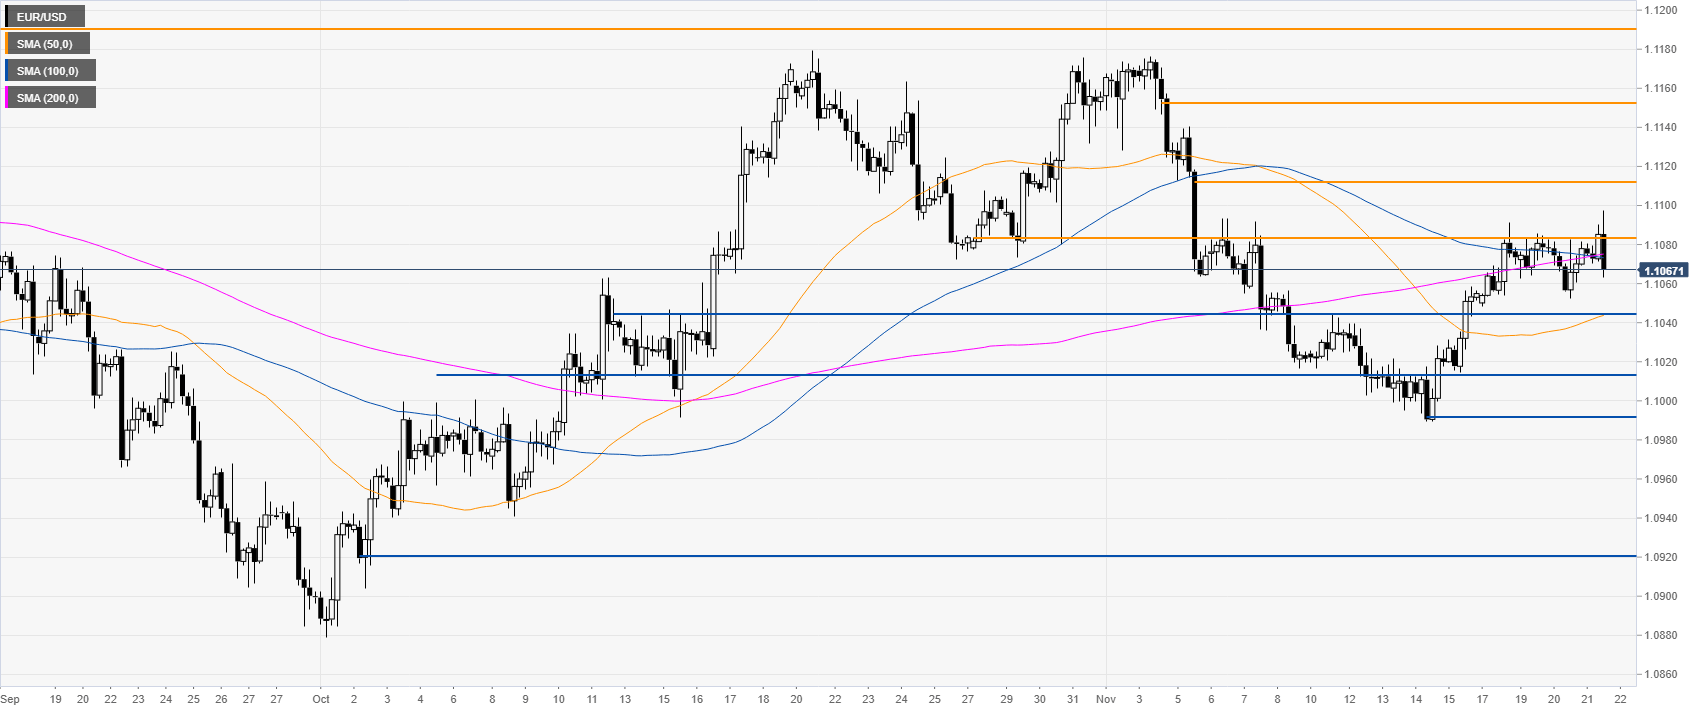
EUR/USD four-hour chart
The market is trading back below the 100 and 200 SMAs while the market is trading below the 1.1083 resistance level. A daily close below the 1.1083 level would signal a failed bullish breakout which can result in a decline in the coming sessions.
A daily close below 1.1043 level can see the bears taking the helm and drive the market towards the 1.1014 and 1.0991 levels, according to the Technical Confluences Indicator.
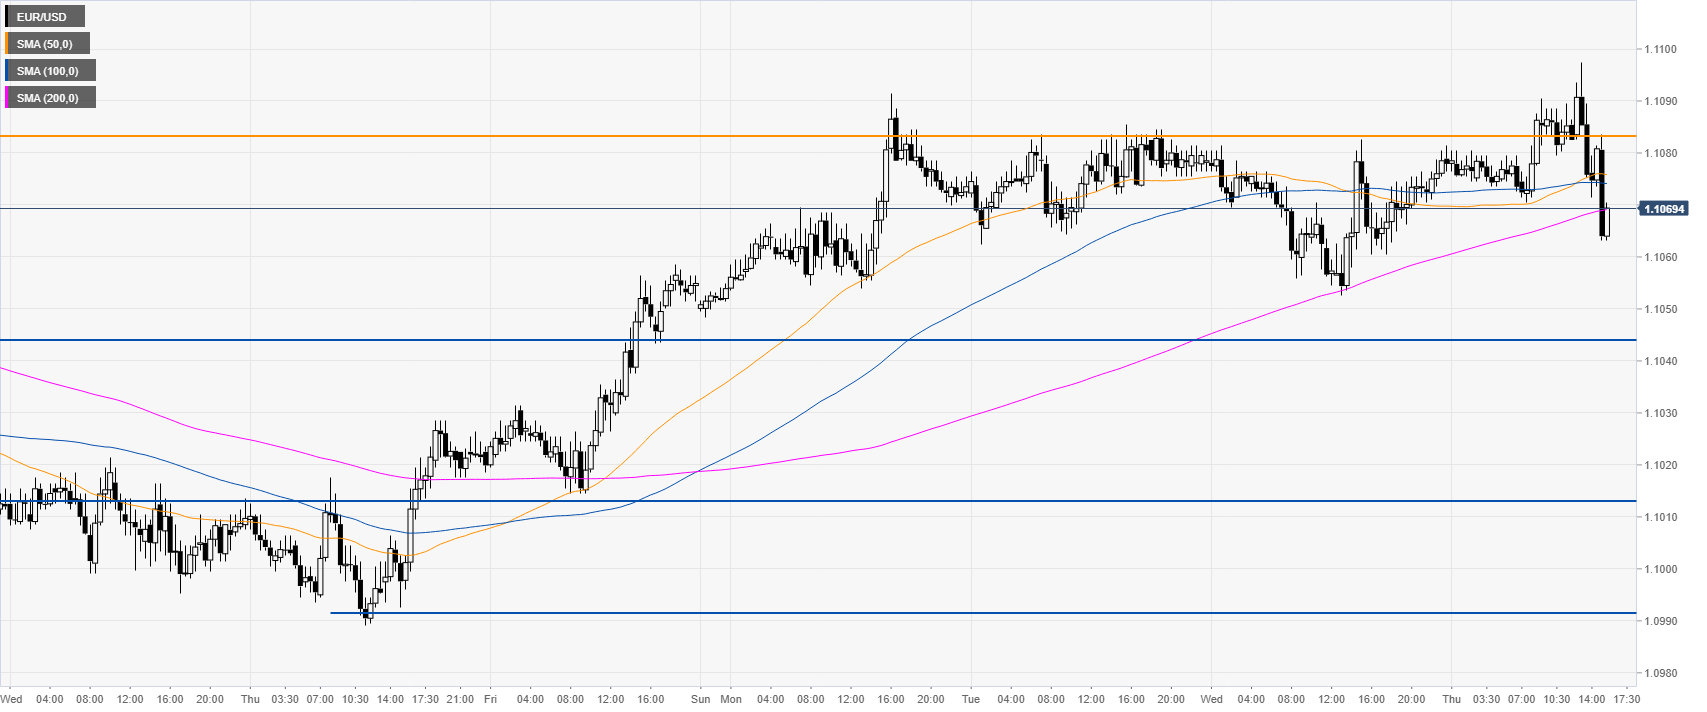
EUR/USD 30-minute chart
EUR/USD is trading below the 200 SMA, suggesting a bearish bias in the near term. The main resistance on the way up is the 1.1083 level, according to the Technical Confluences Indicator.
Additional key levels
