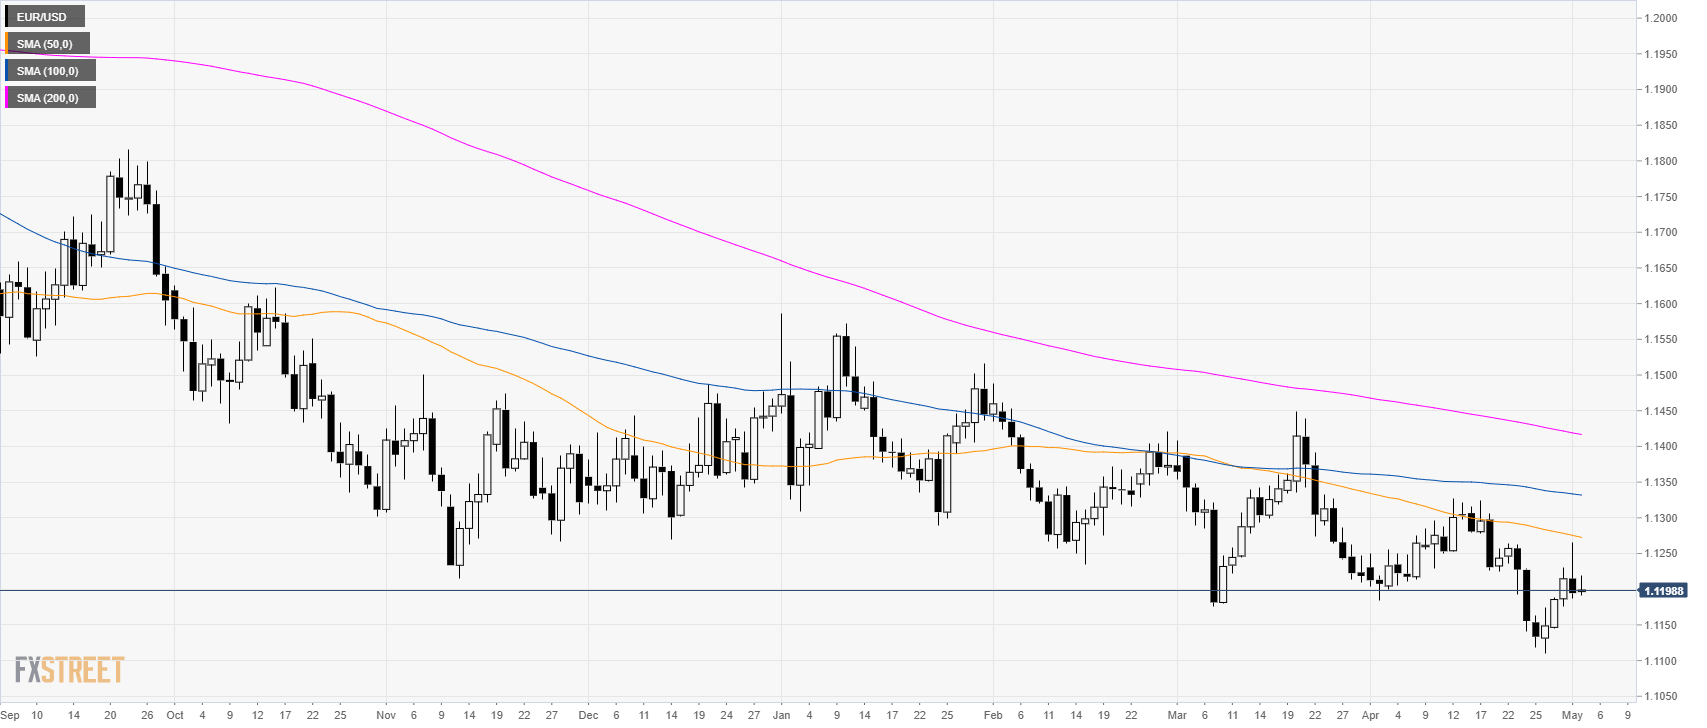
EUR/USD daily chart
- EUR/USD is trading in a bear trend below its main simple moving average (SMAs).
- On Wednesday Fed’s Powell was less dovish than expected sending the USD up across the board.
- As discussed, EUR/USD found resistance just below 1.1270 level.
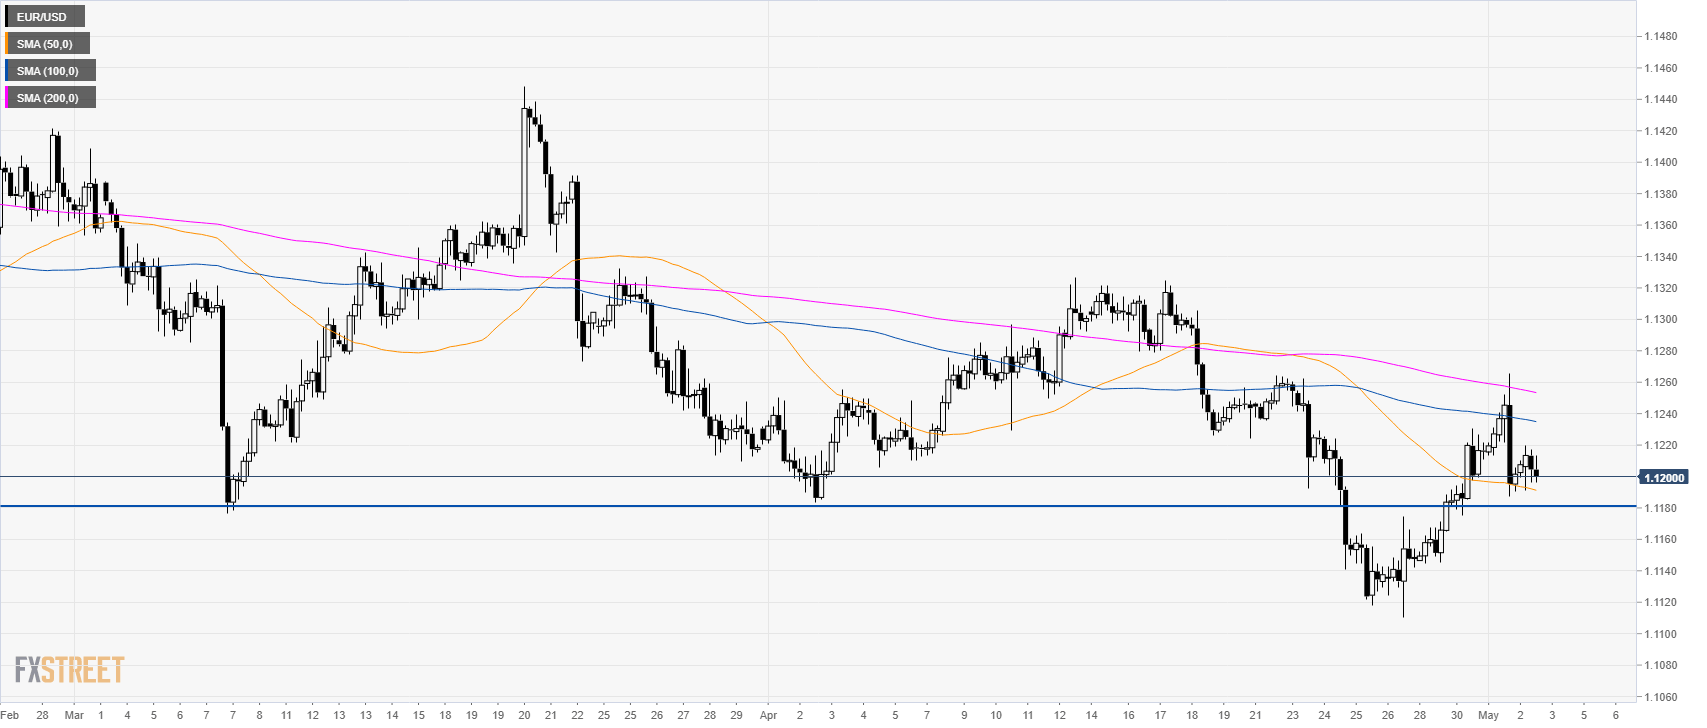
EUR/USD 4-hour chart
- EUR/USD is trading below its 100 and 200 SMA as the bears generated a strong selloff to 1.1187 and the 50 SMA.
- 1.1180 is a key support. A break below would be seen as bearish.
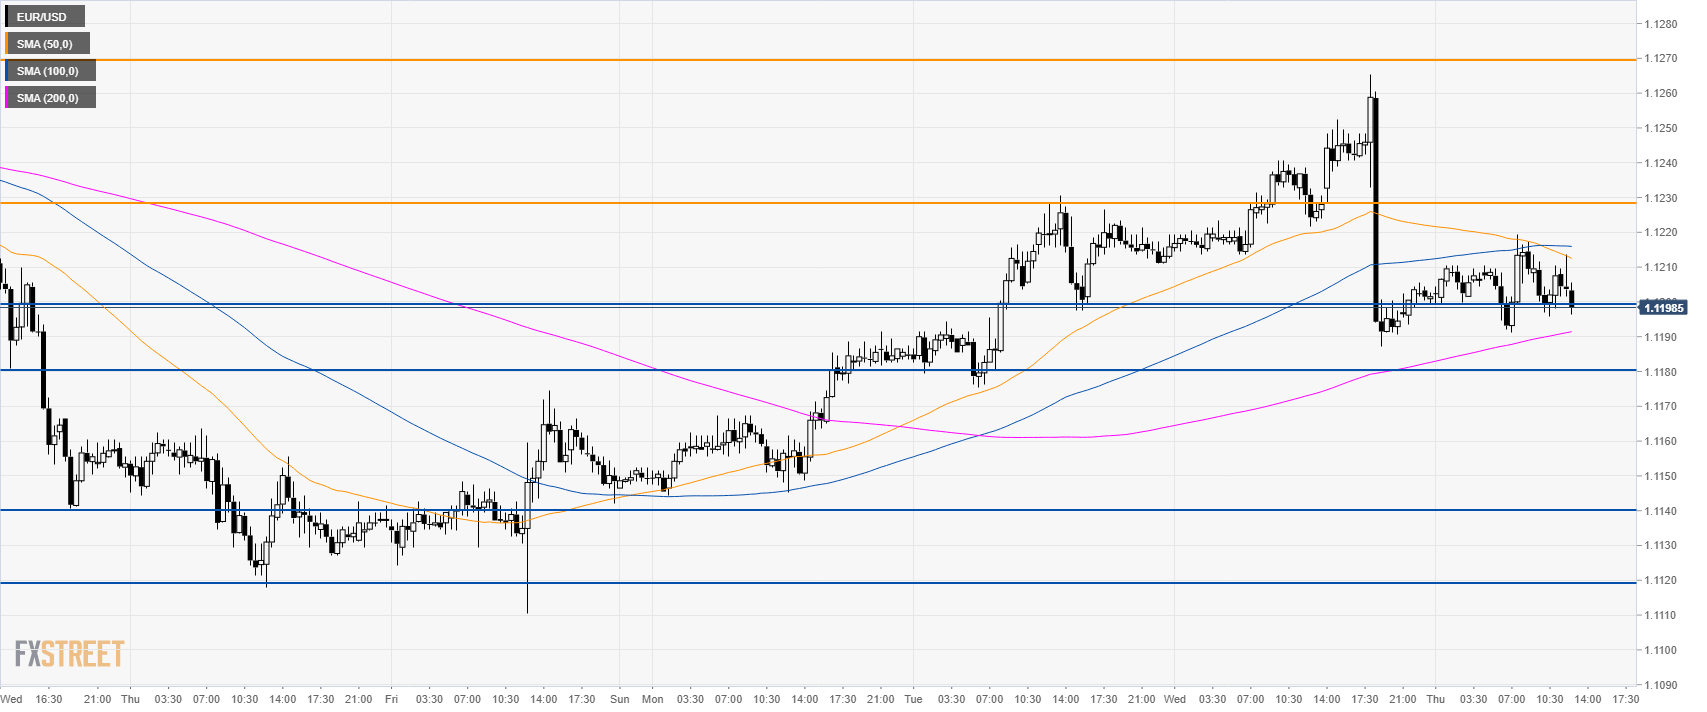
EUR/USD 30-minute chart
- EUR/USD is trading near the 1.1200 figure just above its 200 SMA. The 50 SMA crossed below the 100 SMA suggesting that the outlook for the Fiber is deteriorating.
- A break below 1.1180 can lead to a decline towards 1.1140 and 1.1120 support.
- Resistances are seen at 1.1230 and 1.1270 level.
Additional key levels
