- EUR/USD bounces off 23.6% Fibonacci retracement after Thursday’s bullish candlestick formation.
- Buyers aim for 1.1110/13 resistance-confluence with 1.1000 be on sellers radar.
Having been supported by a bullish candlestick formation, EUR/USD takes the bids to 1.1050 during early Friday.
The pair formed an ‘inverted hammer” candle while following the daily chart, which in turn favors the upside towards 1.1110/13 resistance-confluence including 50-day simple moving average (SMA) and 38.2% Fibonacci retracement of June-September decline.
However, pair’s further upside can be challenged by August 26 high of 1.1165, 50% Fibonacci retracement level of 1.1170 and 100-day SMA level near 1.1180.
Alternatively, pair’s declines below 23.6% Fibonacci retracement level of 1.1040 can push the sellers to re-target 1.1000 round-figure with 1.0960 and 1.0930/25 likely being following support levels to watch,
EUR/USD daily chart
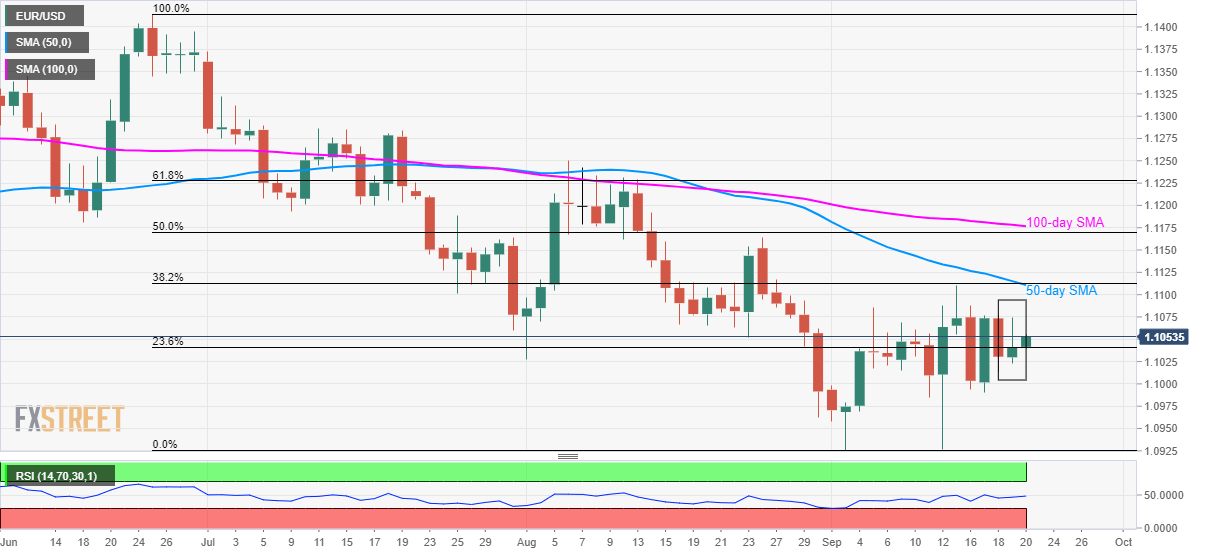
Trend: recovery expected
