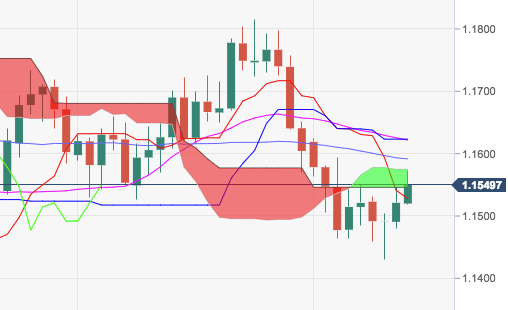
- The pair’s recovery has met a strong resistance in the 1.1570 region so far, although the bull run still carries the potential to re-visit the 55-day SMA at 1.1592 ahead of 1.1623, where sits the 21-day SMA.
- In case the bullish impetus gathers further traction, then the 1.1790 region should return to the radars.
- On a resumption of the weak note, immediate contention emerges at weekly lows in the 1.1435/30 band ahead of the critical 200-dweek SMA at 1.1326.
EUR/USD
Overview:
Last Price: 1.1547
Daily change: 26 pips
Daily change: 0.226%
Daily Open: 1.1521
Trends:
Daily SMA20: 1.1625
Daily SMA50: 1.1585
Daily SMA100: 1.163
Daily SMA200: 1.1925
Levels:
Daily High: 1.1546
Daily Low: 1.148
Weekly High: 1.1625
Weekly Low: 1.1464
Monthly High: 1.1816
Monthly Low: 1.1464
Daily Fibonacci 38.2%: 1.1521
Daily Fibonacci 61.8%: 1.1505
Daily Pivot Point S1: 1.1485
Daily Pivot Point S2: 1.1449
Daily Pivot Point S3: 1.1419
Daily Pivot Point R1: 1.1552
Daily Pivot Point R2: 1.1582
Daily Pivot Point R3: 1.1618
