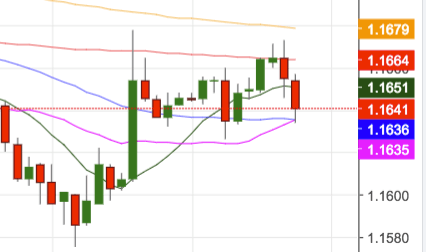
- The pair made a bullish attempt to the 1.1675/80 region on Thursday boosted by comments by US President Trump, although it lacked of follow through and continues to grind lower.
- The area of 1.1670/83, where sit the 21-day SMA, the 10-day SMA and the 200-hour SMA, acted as strong resistance ahead of the more relevant 1.1720/50 band. Here is located the December 2017 low, a Fibo retracement of the April-May drop and the base of the daily cloud.
- The pair’s stance remains bearish following Tuesday’s bearish ‘outside day’ with the immediate target at the 1.1500 neighbourhood.
- The daily RSI reads 45, while a low ADX (today at 18) suggests the current trend is weak.
Daily high: 1.1674
Daily low: 1.1626
Support Levels
S1: 1.1585
S2: 1.1528
S3: 1.1481
Resistance Levels
R1: 1.1689
R2: 1.1736
R3: 1.1793

